11. Performance Evaluation
Question: What are the measurable operational costs and scaling properties of the protocol?
This chapter evaluates GhostShard v0 on a test Network. The evaluation is structured around three themes:
- Gas decomposition — where is gas spent?
- Scaling behavior — how do costs grow with transaction complexity?
- Amortization — how does effective cost per transfer change as more work is bundled?
The number of transfer commands \(N_t\), input shards \(N_i\), and output shards \(N_o\) are observed variables determined by the coin-selection and compression algorithms. Gas costs are analyzed as they emerge from real protocol behavior. All transaction hashes are provided for independent verification.
11.1 Experimental Methodology
This chapter evaluates the performance characteristics of the GhostShard v0 reference implementation. The objective of the evaluation is not to establish optimal gas costs, but rather to analyze protocol behavior, cost decomposition, scalability characteristics, and transaction amortization under realistic operating conditions.
All measurements were collected from real protocol executions on a public Ethereum-compatible network.
11.1.1 Test Network
All experiments were conducted on Arbitrum Sepolia (Chain ID 421614).
Arbitrum Sepolia was selected because it supports EIP-7702, provides deterministic transaction receipts, and enables reproducible testing under realistic execution conditions.
All reported measurements were obtained from successful on-chain transactions and can be independently verified using the corresponding transaction hashes included in the evaluation dataset.
11.1.2 Implementation Versions
| Component | Compiler Version | Contract Address |
|---|---|---|
| GhostRouter | Solidity 0.8.24^ | 0x6f67E047D1Fe5de0b62b187c28dB1cf1F4f560fb |
| GhostShard | Solidity 0.8.24^ | 0x295549A545E41af6cbCe09AbF012de172AC321AE |
| ERC-5564 Announcer | Solidity 0.8.23 | 0x55649E01B5Df198D18D95b5cc5051630cfD45564 |
All contracts were compiled with the Solidity optimizer enabled:
External dependencies include OpenZeppelin implementations of:
- ERC-20
- ERC-721
- ECDSA
- SafeERC20
- ReentrancyGuard
11.1.3 Evaluation Scope
The evaluation focuses on three primary questions:
- How does transaction cost scale with protocol complexity?
- Where is gas consumed during execution?
- Does batching multiple transfers within a mesh transaction provide amortization benefits?
The analysis therefore concentrates on:
- Input shard count
- Output count
- Transfer count
- Authorization overhead
- Execution overhead
- Asset-type differences
rather than absolute gas minimization.
It is important to note that GhostShard v0 is a correctness-oriented reference implementation and has not undergone gas optimization. Consequently, the reported measurements should be interpreted as observations of architectural behavior rather than lower bounds on protocol cost.
11.1.4 Data Collection
Gas measurements were obtained directly from transaction receipts and protocol telemetry emitted by the MeshExecuted event during execution.
Conceptually, the event records:
For each transaction, the following metrics were recorded:
| Metric | Description |
|---|---|
| \((G_{total})\) | Total transaction gas consumed |
| \((G_{contract})\) | Gas consumed by contract logic |
| \((G_{execution})\) | Gas consumed inside innerExecuteMesh() |
| \((N_i)\) | Number of input shards |
| \((N_o)\) | Number of output announcements |
| \((N_t)\) | Number of transfers executed |
| Asset Type | Native ETH, ERC-20, or ERC-721 |
From these measurements, two additional quantities are derived:
Preverification Gas
Preverification gas captures costs imposed by transaction-level authorization processing, EIP-7702 authorization handling, calldata validation, and node-level execution overhead.
where:
represents total gas consumed after execution enters the router contract.
Verification Gas
Verification gas captures protocol-level validation costs performed by the router prior to asset movement.
Examples include:
- Signature verification
- Delegation validation
- Authorization checks
- Replay protection checks
- State validation
Verification gas is computed as:
where:
represents gas consumed by actual mesh execution and asset-transfer logic.
11.1.5 Asset Classes
Measurements were collected across all asset types currently supported by GhostShard v0.
Native ETH
Native asset transfers are executed through:
ERC-20
Token transfers are executed through:
ERC-721
NFT transfers are executed through:
Evaluating multiple asset classes allows the analysis to distinguish protocol overhead from asset-specific execution costs.
11.1.6 Transaction Sample Construction
The evaluation dataset was generated using the GhostShard SDK operating under realistic wallet conditions.
Transaction structure was not manually engineered for benchmarking purposes.
Instead:
- Coin selection determined input shard counts.
- Compression logic determined transfer structure.
- Recipient generation determined output counts.
- Wallet state influenced mesh composition.
Consequently, the values of
vary naturally across the dataset.
This methodology ensures that measurements reflect actual protocol behavior rather than artificially constructed benchmark scenarios.
The resulting dataset therefore captures realistic execution patterns likely to be encountered by future GhostShard versions.
11.1.7 Reproducibility
All measurements originate from publicly verifiable on-chain transactions executed on Arbitrum Sepolia.
The complete evaluation dataset includes:
- Transaction hashes
- Gas measurements
- Input counts
- Output counts
- Transfer counts
- Asset classifications
This enables independent verification and reproduction of all reported results.
11.2 Gas Cost Breakdown
This section analyzes where gas is consumed during GhostShard execution.
For every mesh transaction, total gas consumption can be decomposed into three independent components:
where:
and
corresponds to the gas consumed inside the isolated mesh execution sandbox recorded through the MeshExecuted event.
Conceptually,
The separation is useful because each component scales differently.
- Preverification gas is primarily driven by EIP-7702 authorization processing and transaction-level validation.
- Verification gas captures GhostRouter ownership checks, replay protection, delegation validation, and paymaster verification.
- Execution gas captures actual protocol work, including asset transfers, announcement publication, and mesh execution.
Figure 11.2.1 — Total Gas Breakdown Per Transaction
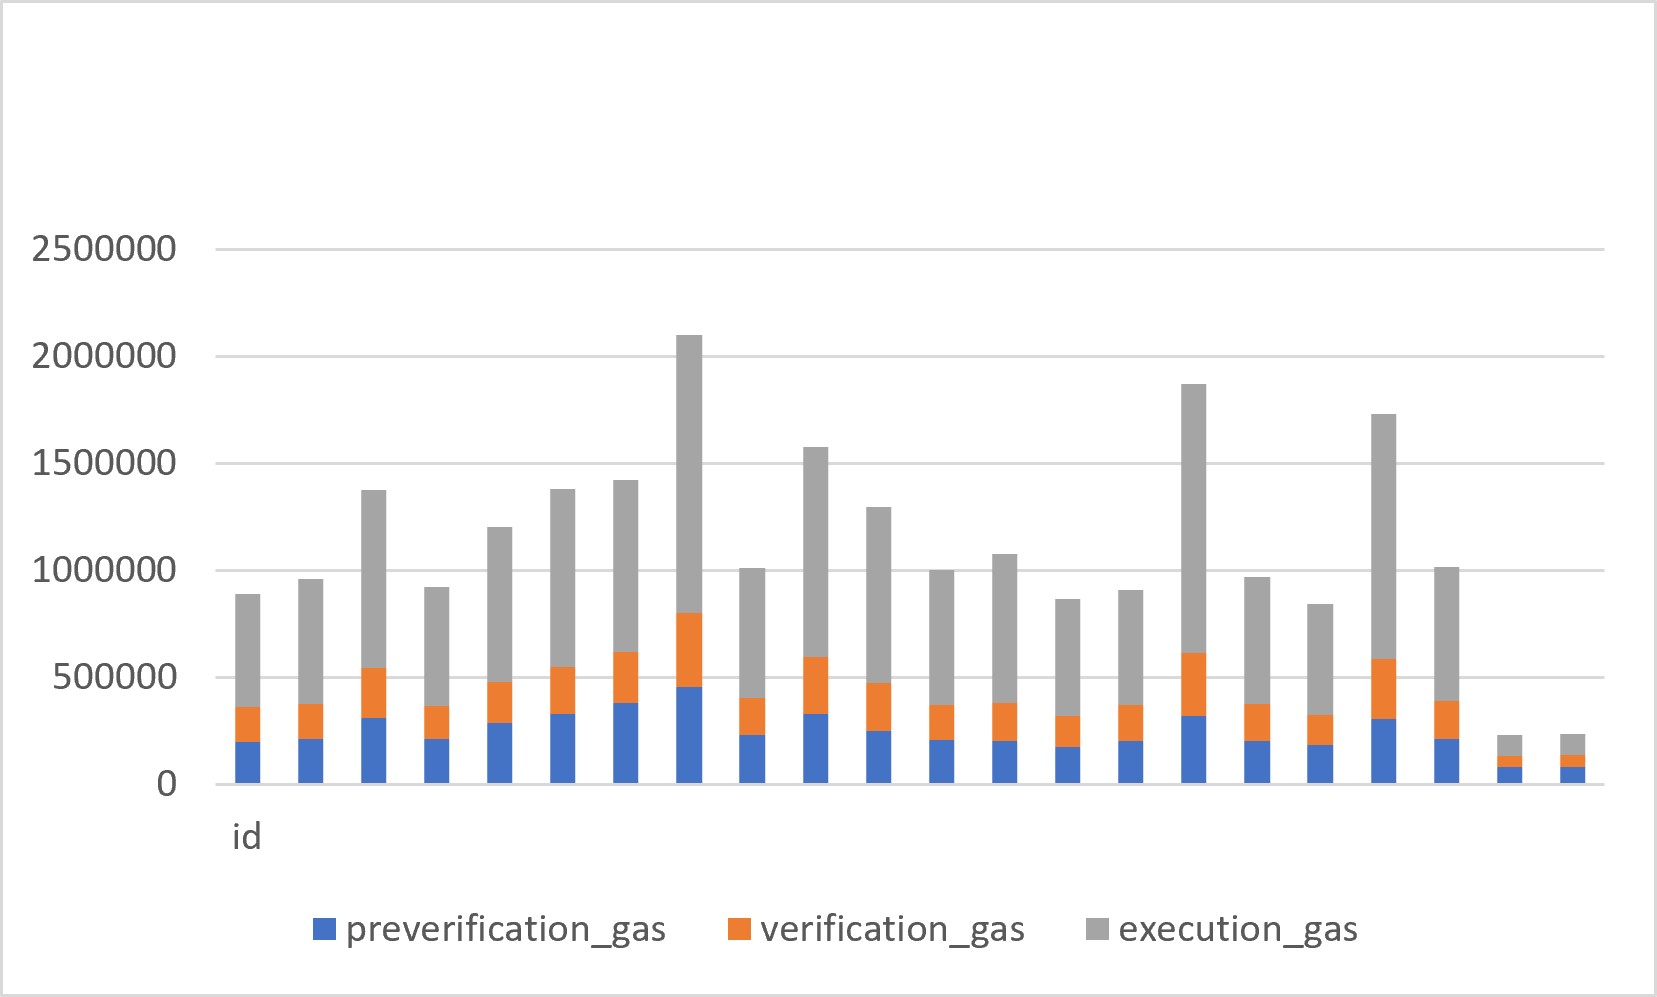
Figure 11.2.1. Execution gas dominates total consumption across all transaction categories, while preverification and verification overhead scale with transaction complexity.
Figure 11.2.2 — Average Gas Decomposition by Asset Type
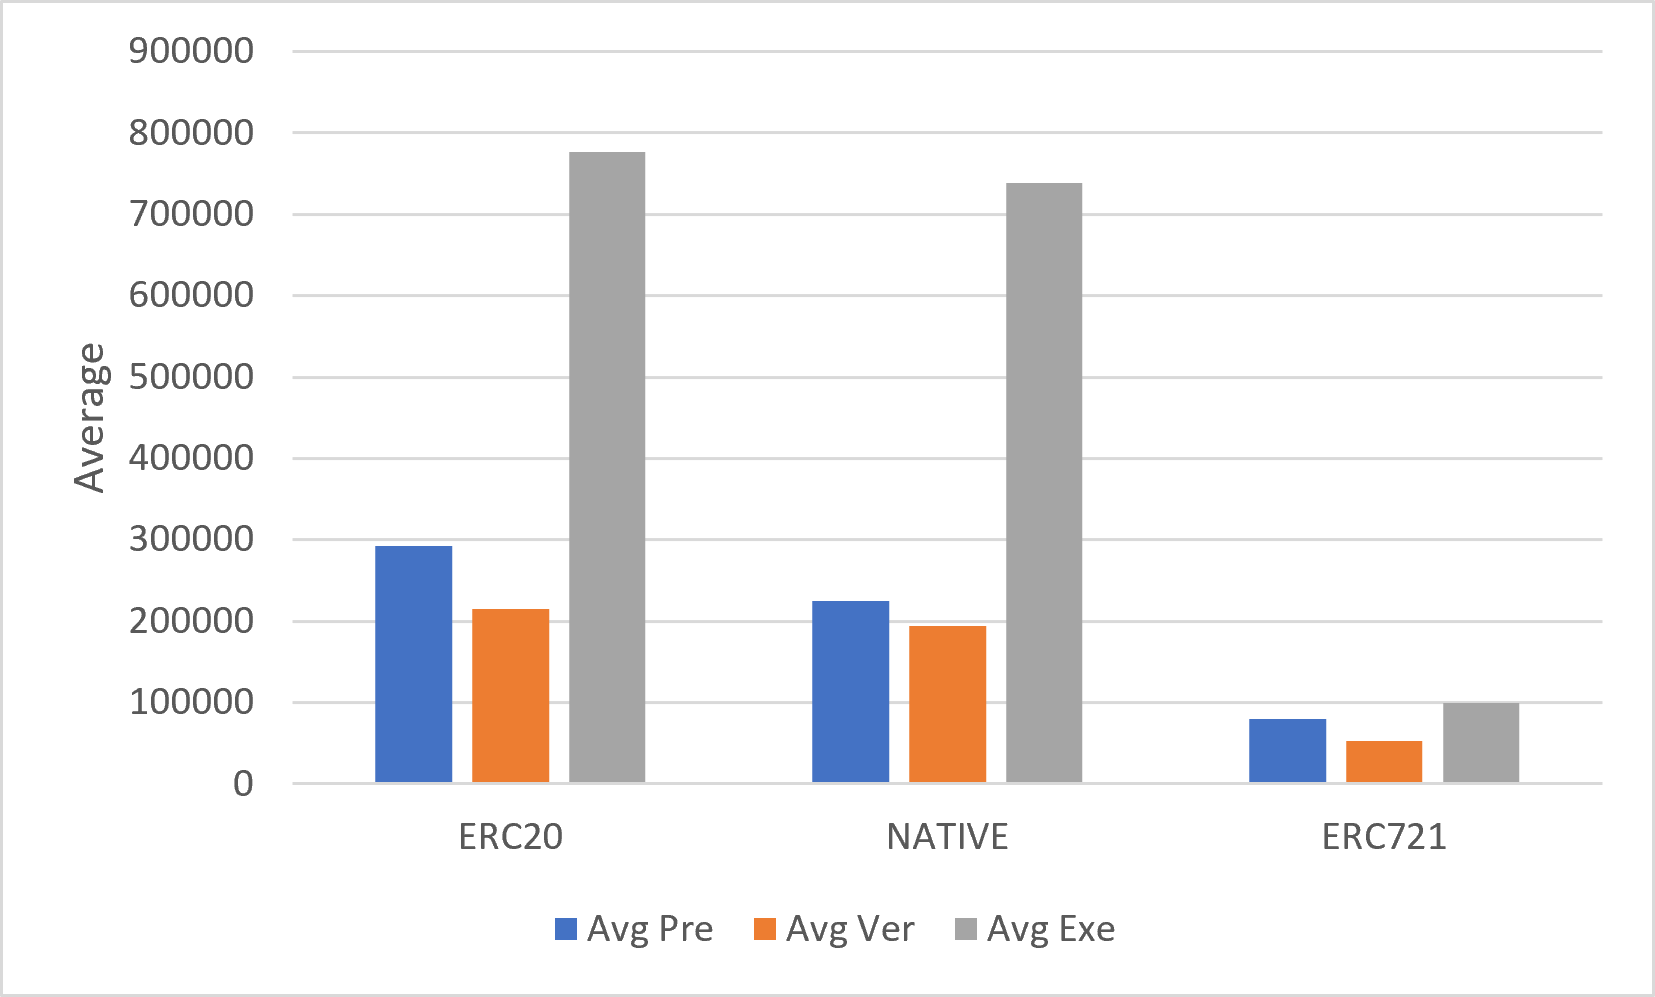
Figure 11.2.2. Average gas decomposition across measured asset classes. Execution gas is the dominant contributor for all asset types.
Table 11.2.1 — Average Gas Decomposition by Asset Type
| Asset Type | Average Preverification Gas | Average Verification Gas | Average Execution Gas | Average Total Gas |
|---|---|---|---|---|
| ERC-20 | 292,935 | 214,660 | 776,367 | 1,283,962 |
| Native | 224,553 | 193,749 | 738,516 | 1,156,818 |
| ERC-721 | 80,320 | 52,681 | 98,909 | 231,910 |
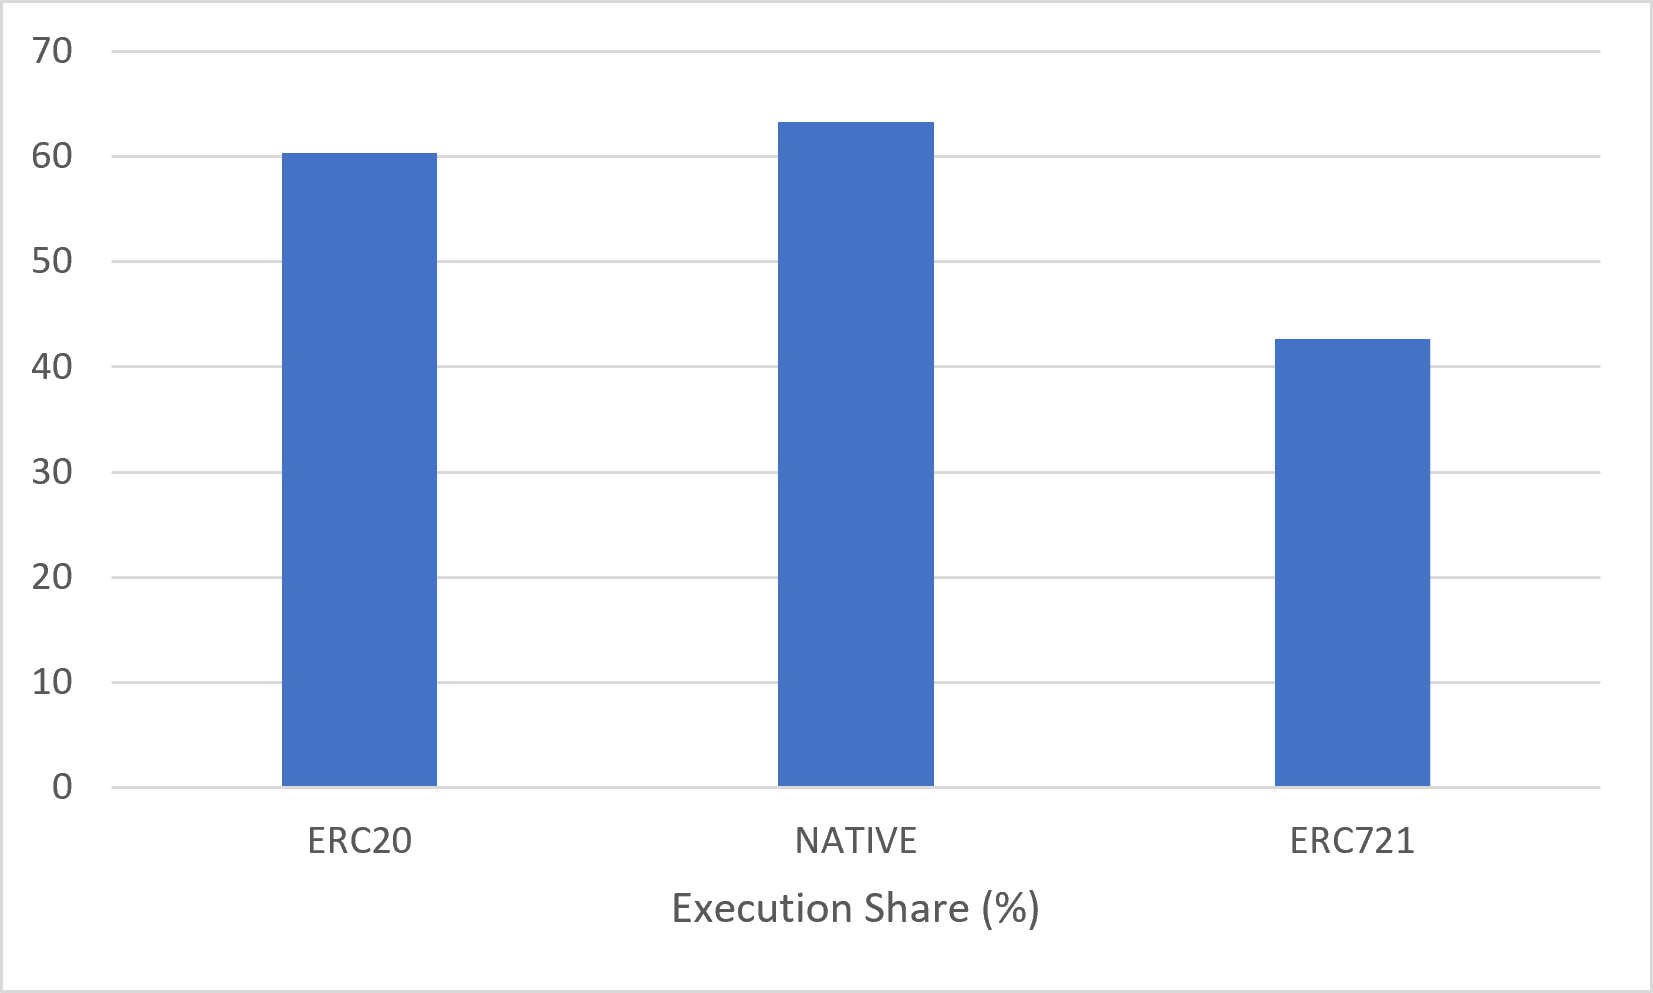
Figure 11.2.3 — Relative Gas Composition by Asset Type
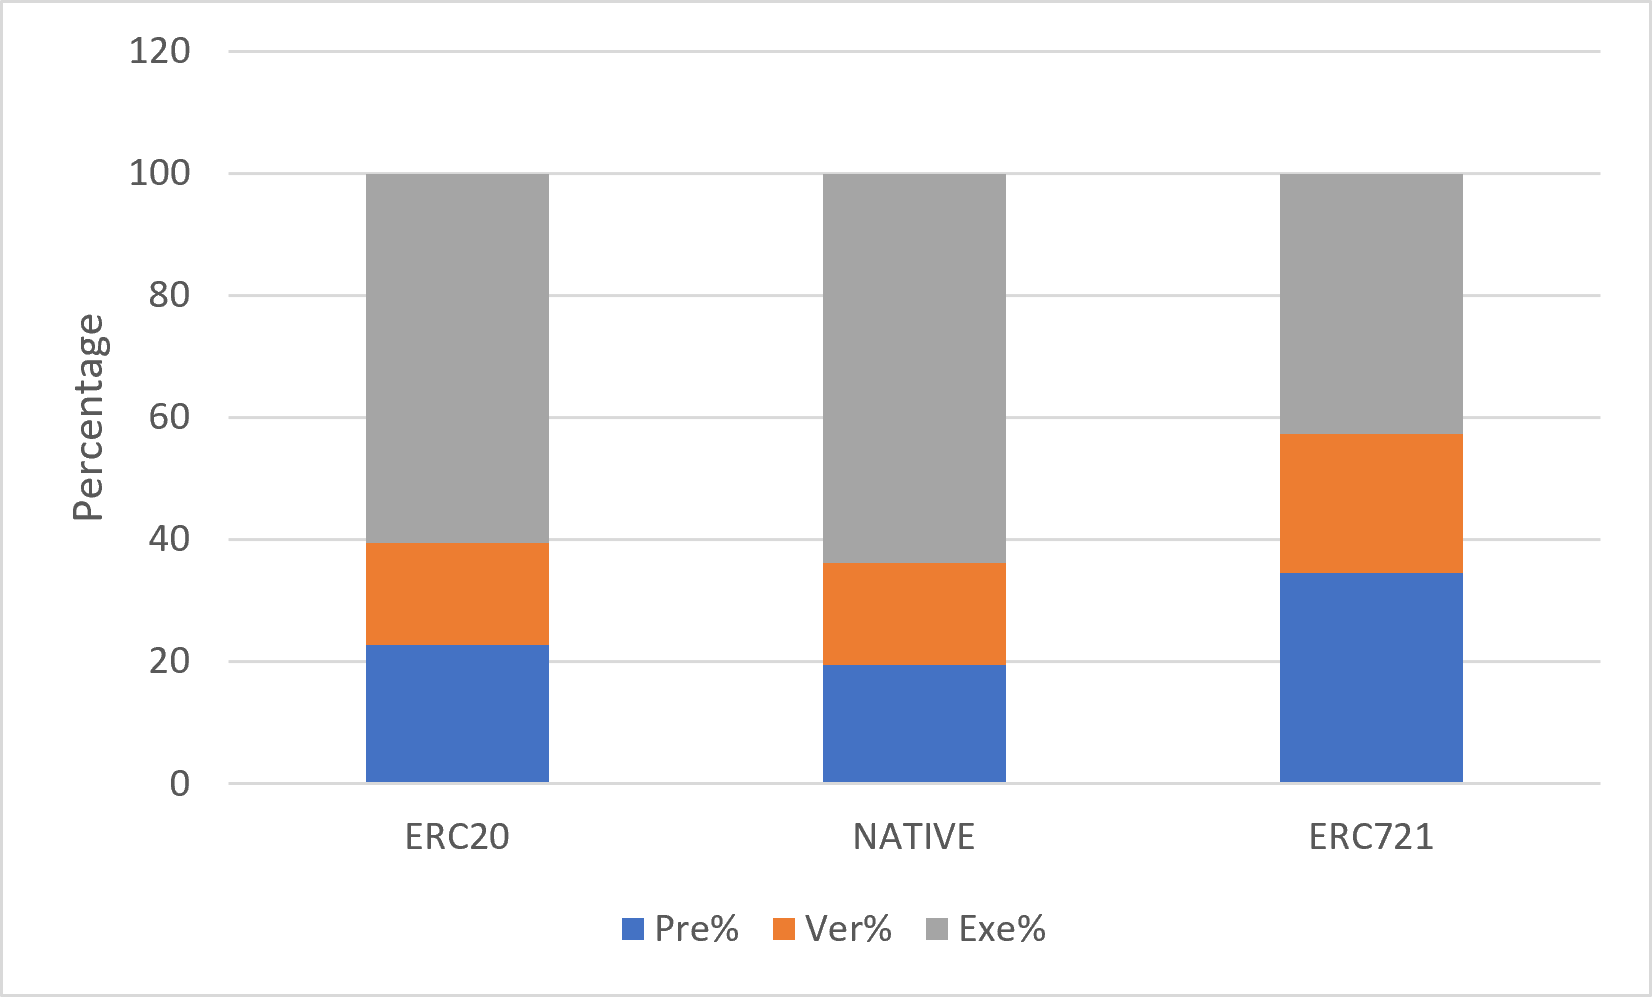
Figure 11.2.3. Relative contribution of each gas component. For both Native and ERC-20 transfers, approximately 60–64% of total gas is spent performing protocol execution rather than administrative validation.
Table 11.2.2 — Relative Gas Composition by Asset Type
| Asset Type | Preverification (%) | Verification (%) | Execution (%) |
|---|---|---|---|
| ERC-20 | 22.81 | 16.72 | 60.47 |
| Native | 19.41 | 16.75 | 63.84 |
| ERC-721 | 34.63 | 22.72 | 42.65 |
Observations
Several observations emerge from the decomposition.
- Execution gas is the dominant contributor across all measured transactions.
- Verification gas forms the second-largest component and scales with participating shard count.
- Preverification gas remains the smallest component but increases with transaction complexity because each additional shard introduces EIP-7702 authorization overhead.
- ERC-20 and Native transfers exhibit similar cost structures despite different transfer mechanisms.
- ERC-721 transactions appear significantly cheaper due to the limited complexity of the measured sample.
- The relatively small difference between Native and ERC-20 execution costs suggests that GhostShard amortizes much of its fixed protocol overhead across multiple transfers.
Overall, the decomposition demonstrates that GhostShard spends the majority of gas performing useful protocol work rather than administrative validation.
11.3 Scaling Analysis
This section evaluates how GhostShard scales as transaction complexity increases.
Three observable variables are considered:
- Input shards (\(N_i\))
- Output shards (\(N_o\))
- Transfer commands (\(N_t\))
All three quantities emerge naturally from the coin-selection and mesh-construction algorithms described in Chapter 7.
Transfer Commands as the Unit of Work
An important observation from the dataset is that transfer count and input count are not equivalent.
For example:
- TX-01 uses 4 input shards but produces 11 transfer commands.
- TX-07 uses 9 input shards but produces 19 transfer commands.
This demonstrates that a single shard may generate multiple transfer commands when value is partitioned across multiple outputs.
Consequently, transfer count is a more accurate representation of protocol workload than shard count alone.
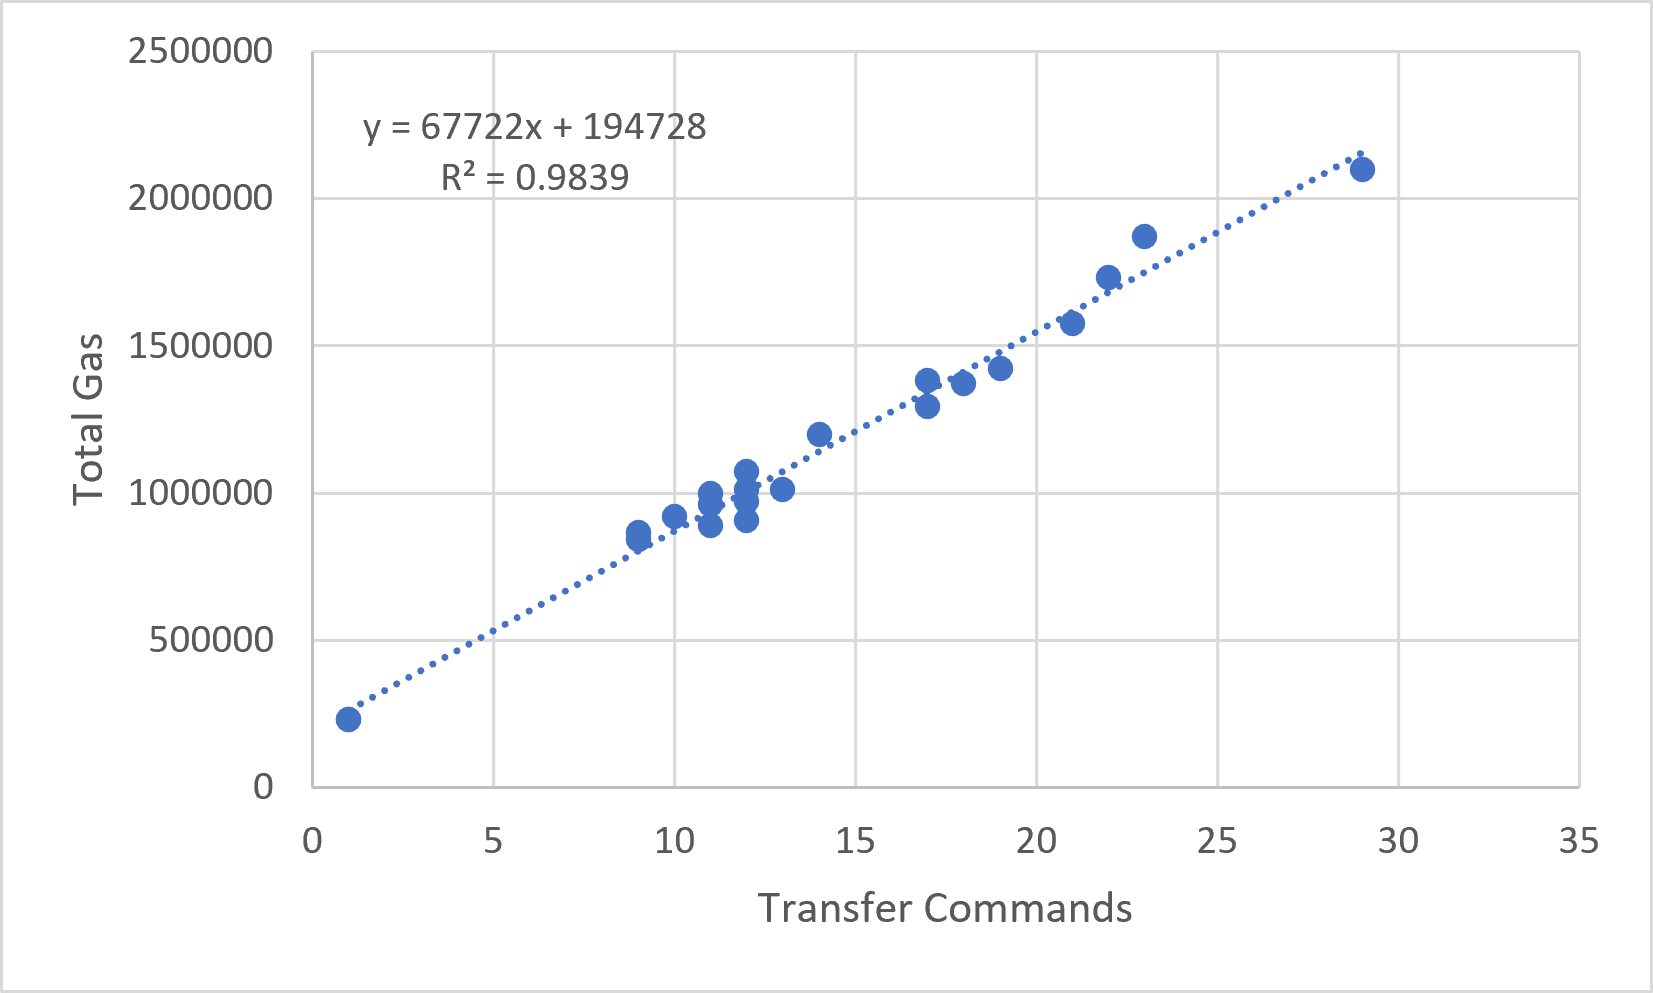
Figure 11.3.1 — Total gas vs Transfer count.
Observation
Transfer count is the strongest predictor of gas consumption observed in the evaluation.
Approximately:
of the variation in total gas usage is explained solely by transfer count.
No evidence of super-linear growth was observed across the measured range of:
transfer commands.
This result indicates that GhostShard scales approximately linearly with protocol work.
Figure 11.3.2 — Total gas vs Input Shard count.
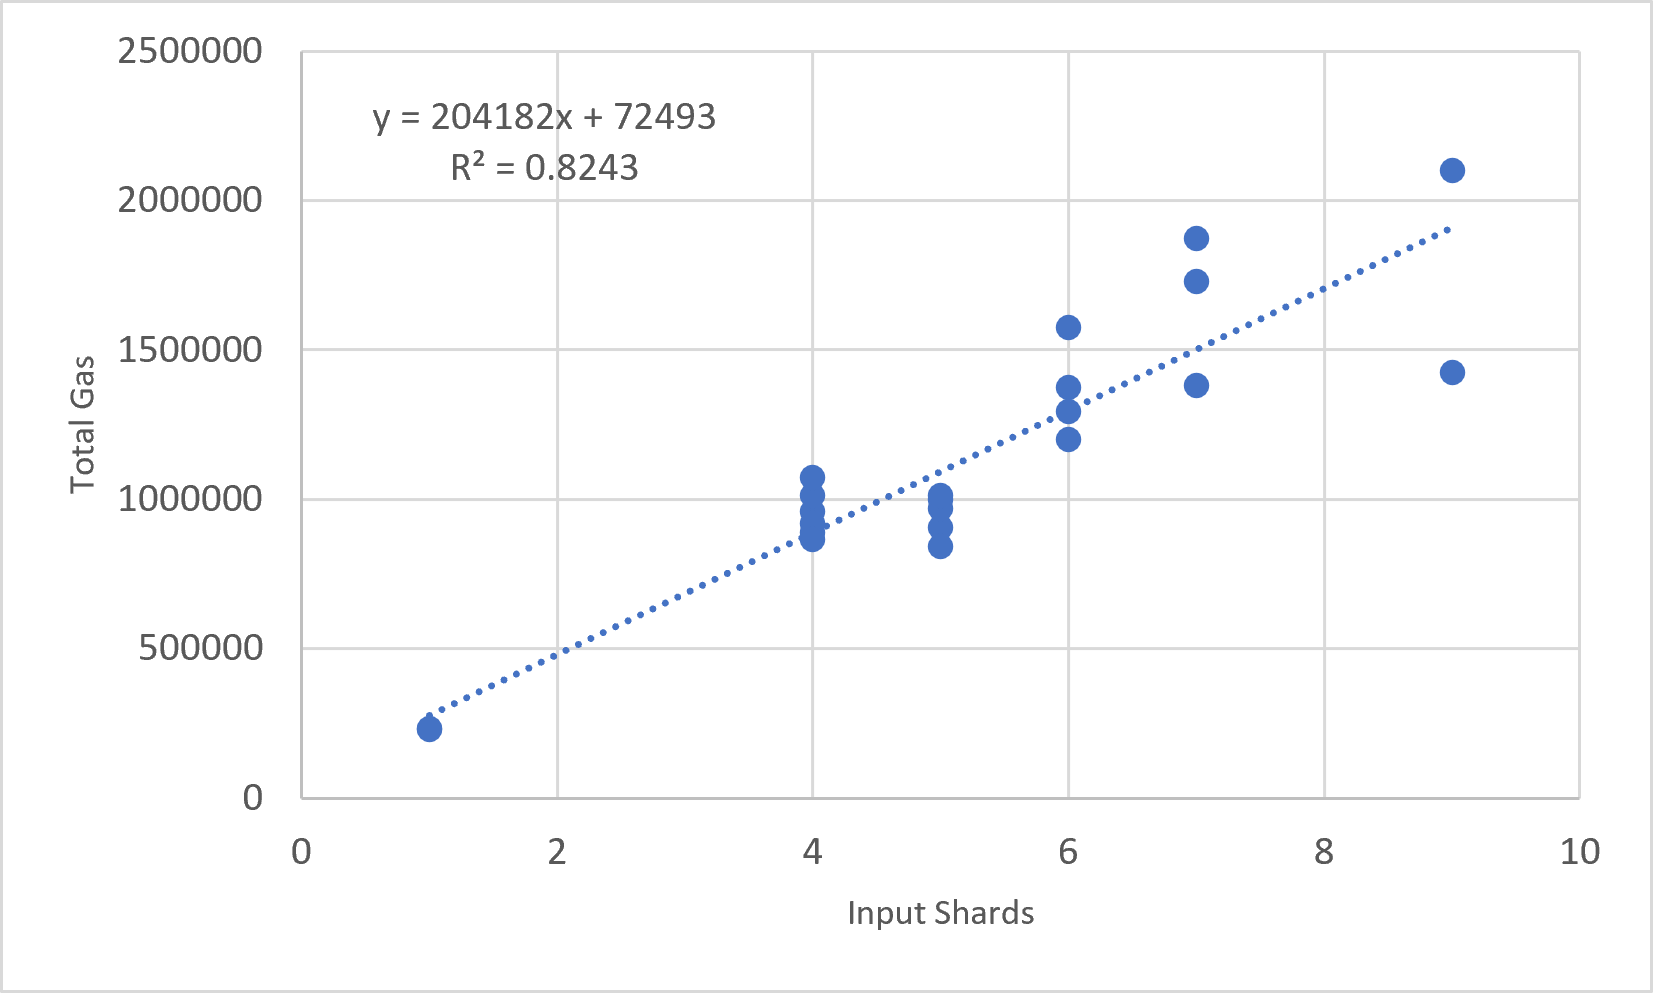
Observation
Input count remains strongly correlated with gas consumption but performs significantly worse than transfer count.
This occurs because input count does not fully capture protocol workload.
Two transactions may consume the same number of shards while producing different numbers of transfer commands.
As a result, shard count serves only as an approximate proxy for transaction complexity.
Figure 11.3.2 — Total gas vs Output Shard count.
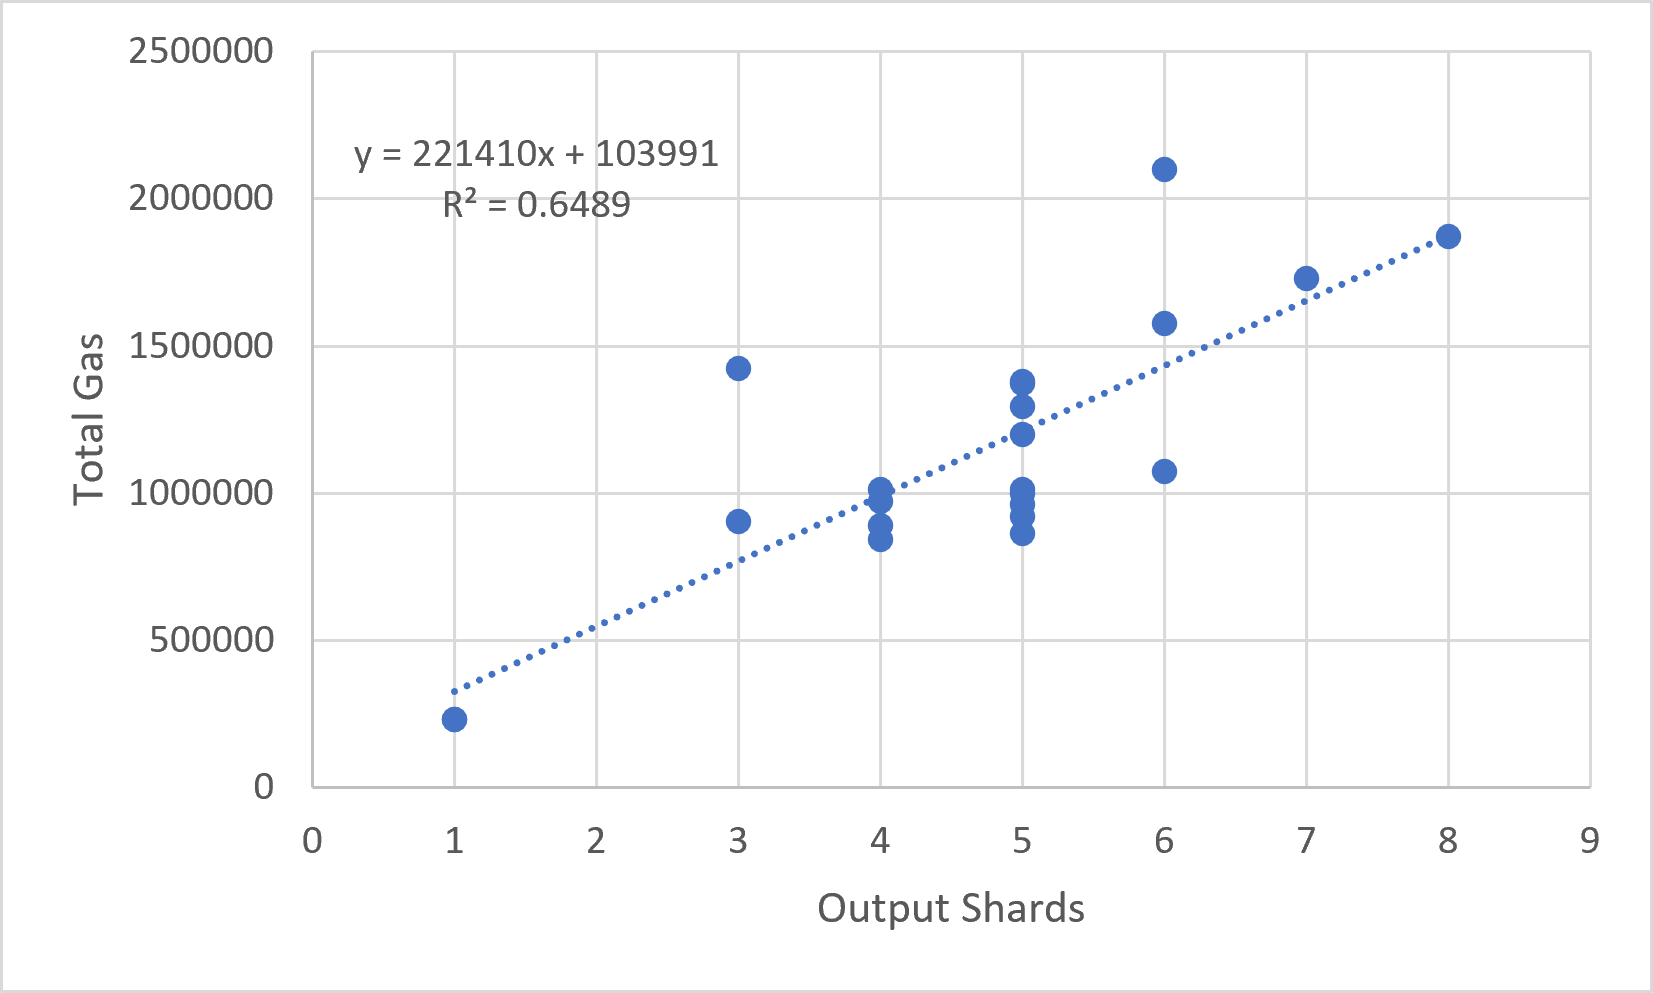
Observation
Output count exhibits the weakest relationship with gas consumption.
While output creation contributes to execution cost, recipient count alone does not accurately describe protocol workload.
Transactions containing identical output counts may perform substantially different numbers of transfers.
Consequently, output count should not be considered a primary scaling metric.
Scaling Summary
| Relationship | Regression Model | \(R^2\) |
|---|---|---|
| Total Gas vs Transfer Commands | \(194,728 + 67,722N_t\) | 0.984 |
| Total Gas vs Input Shards | \(72,493 + 204,182N_i\) | 0.824 |
| Total Gas vs Output Shards | \(103,991 + 221,410N_o\) | 0.649 |
Discussion
The evaluation demonstrates that transfer commands constitute the primary unit of protocol work within GhostShard.
Transfer count substantially outperforms both input count and output count as a predictor of gas consumption.
The near-linear relationship observed in Figure 3 suggests that GhostShard scales predictably as transaction complexity increases.
Within the evaluated range, each additional transfer command contributes approximately:
on average.
This behavior is consistent across Native and ERC-20 transactions and provides evidence that GhostShard's execution model scales linearly rather than super-linearly.
Among all results presented in Chapter 11, Figure 3 represents the strongest empirical validation of the protocol's scalability properties.
11.4 Verification Cost Scaling
This section isolates the authorization and validation layer of GhostShard — the gas consumed proving that a transaction is valid before any asset movement occurs.
Because GhostShard separates validation from execution through its pre-scan matrix architecture, verification costs can be measured independently from asset-transfer costs.
Verification gas is defined as:
where:
- \(G_{\text{contract}}\) is the gas consumed inside GhostRouter execution.
- \(G_{\text{execution}}\) is the gas reported by the isolated mesh execution sandbox (
innerExecuteMesh).
Similarly, pre-verification gas is defined as:
This decomposition allows validation overhead to be analyzed separately from asset-transfer costs.
Figure 11.4.1 — Pre-verification Gas vs Input Shards.
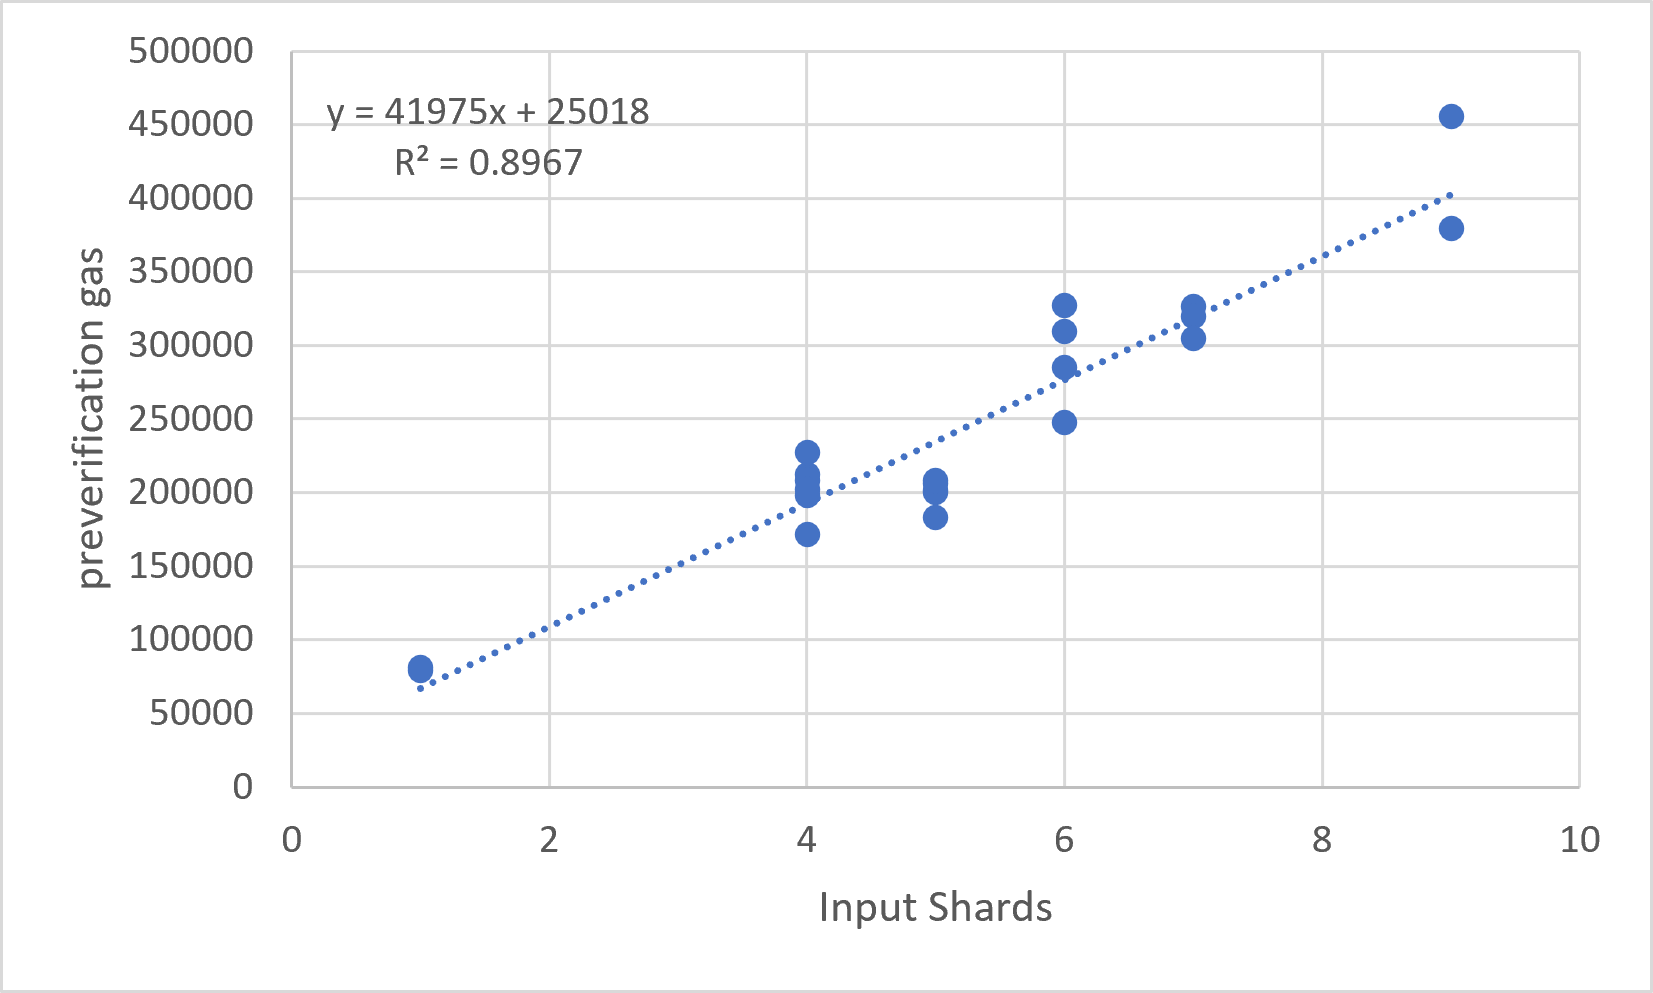
Table 11.4.1 — Pre-verification Gas vs Input Shards Observed Ranges.
| Metric | Value |
|---|---|
| Minimum | 79,520 gas |
| Maximum | 455,238 gas |
| Mean | 245,674 gas |
Pre-verification gas exhibits substantial variation, ranging from approximately 80k gas for single-input ERC-721 transactions to over 450k gas for the largest measured mesh transaction.
Unlike execution gas, pre-verification gas does not appear to scale solely as a function of input count.
This behavior is expected because pre-verification includes:
- Transaction calldata processing.
- EIP-7702 authorization validation.
- Signature payload decoding.
- Command-array decoding.
- Announcement-array decoding.
- L1 data fees if applicable
Consequently, transactions with similar numbers of input shards may exhibit noticeably different pre-verification costs if their calldata payloads differ significantly.
The scatter plot therefore demonstrates that pre-verification gas is influenced by overall transaction complexity rather than shard count alone.
Figure 11.4.2 — Verification Gas vs Transfer Commands.
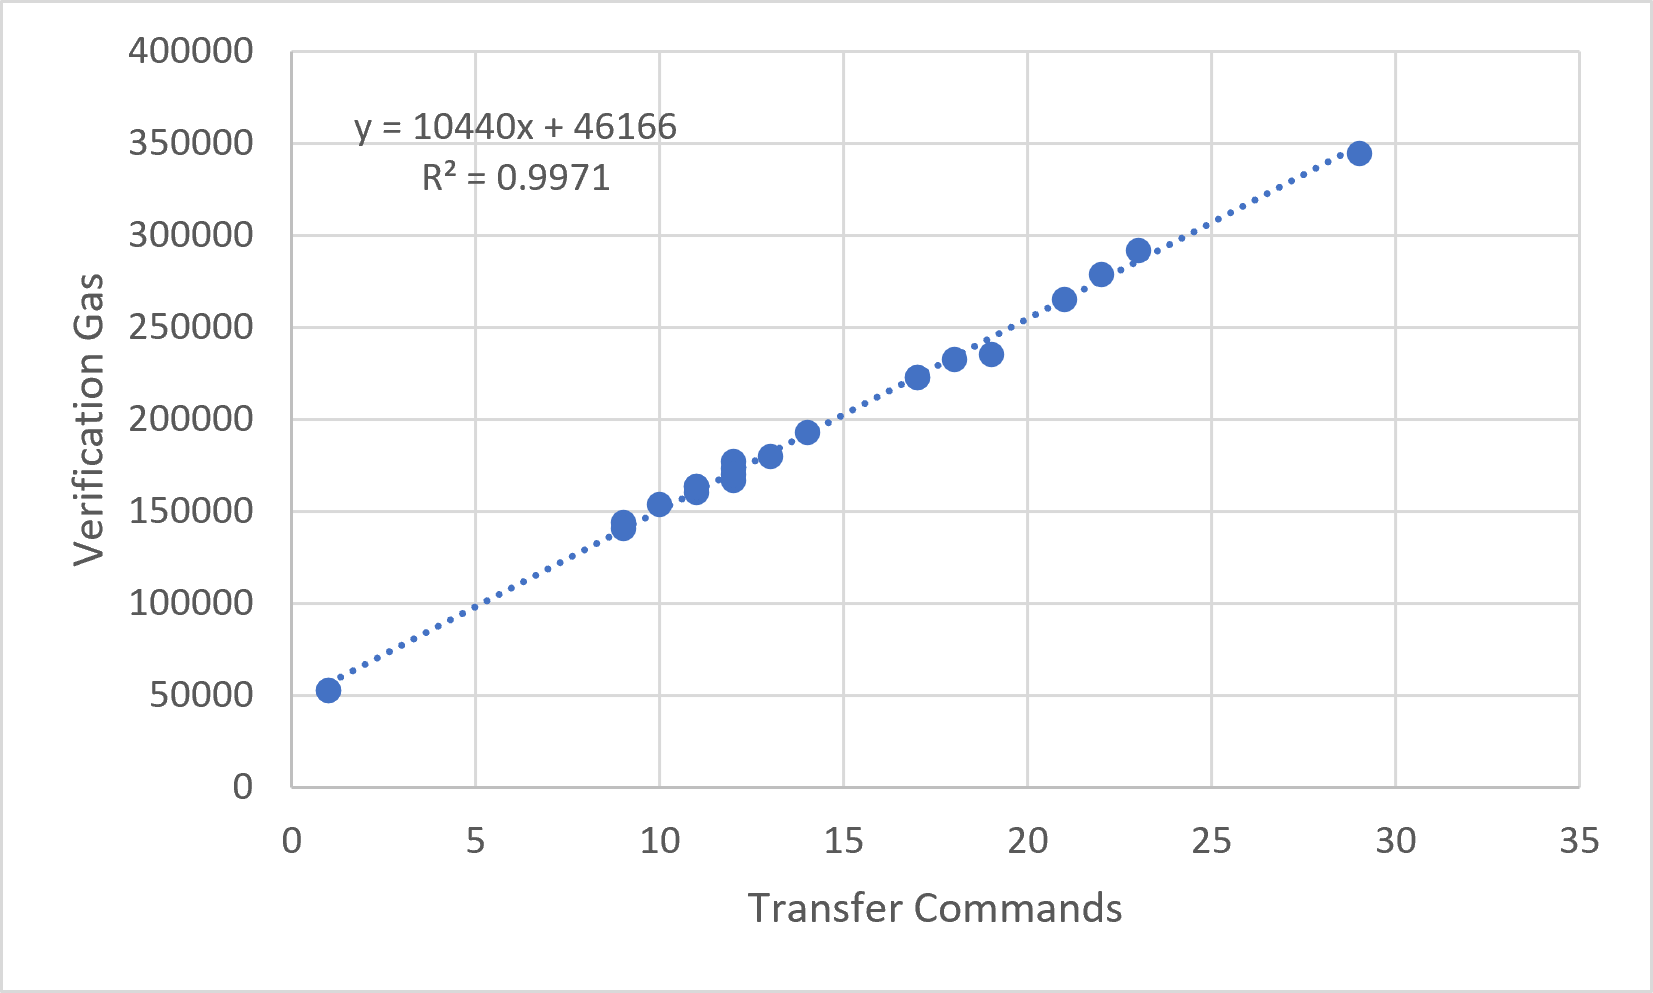
Table 11.4.2 — Verification Gas vs Transfer Commands Observed Ranges.
| Metric | Value |
|---|---|
| Minimum | 52,681 gas |
| Maximum | 344,502 gas |
| Mean | 190,084 gas |
Verification gas displays a strong linear relationship with transfer-command count.
The smallest transactions (single ERC-721 transfers) require approximately:
of verification overhead.
The largest measured transaction:
requires:
of verification overhead.
The resulting trend demonstrates that validation costs scale proportionally with protocol work.
A linear regression should be reported in the final figure:
where:
- \(a\) represents fixed protocol overhead.
- \(b\) represents marginal verification cost per transfer command.
The strong visual linearity suggests that verification overhead scales predictably and does not exhibit super-linear growth.
Figure 11.4.3 — Verification Gas as a Percentage of Total Gas
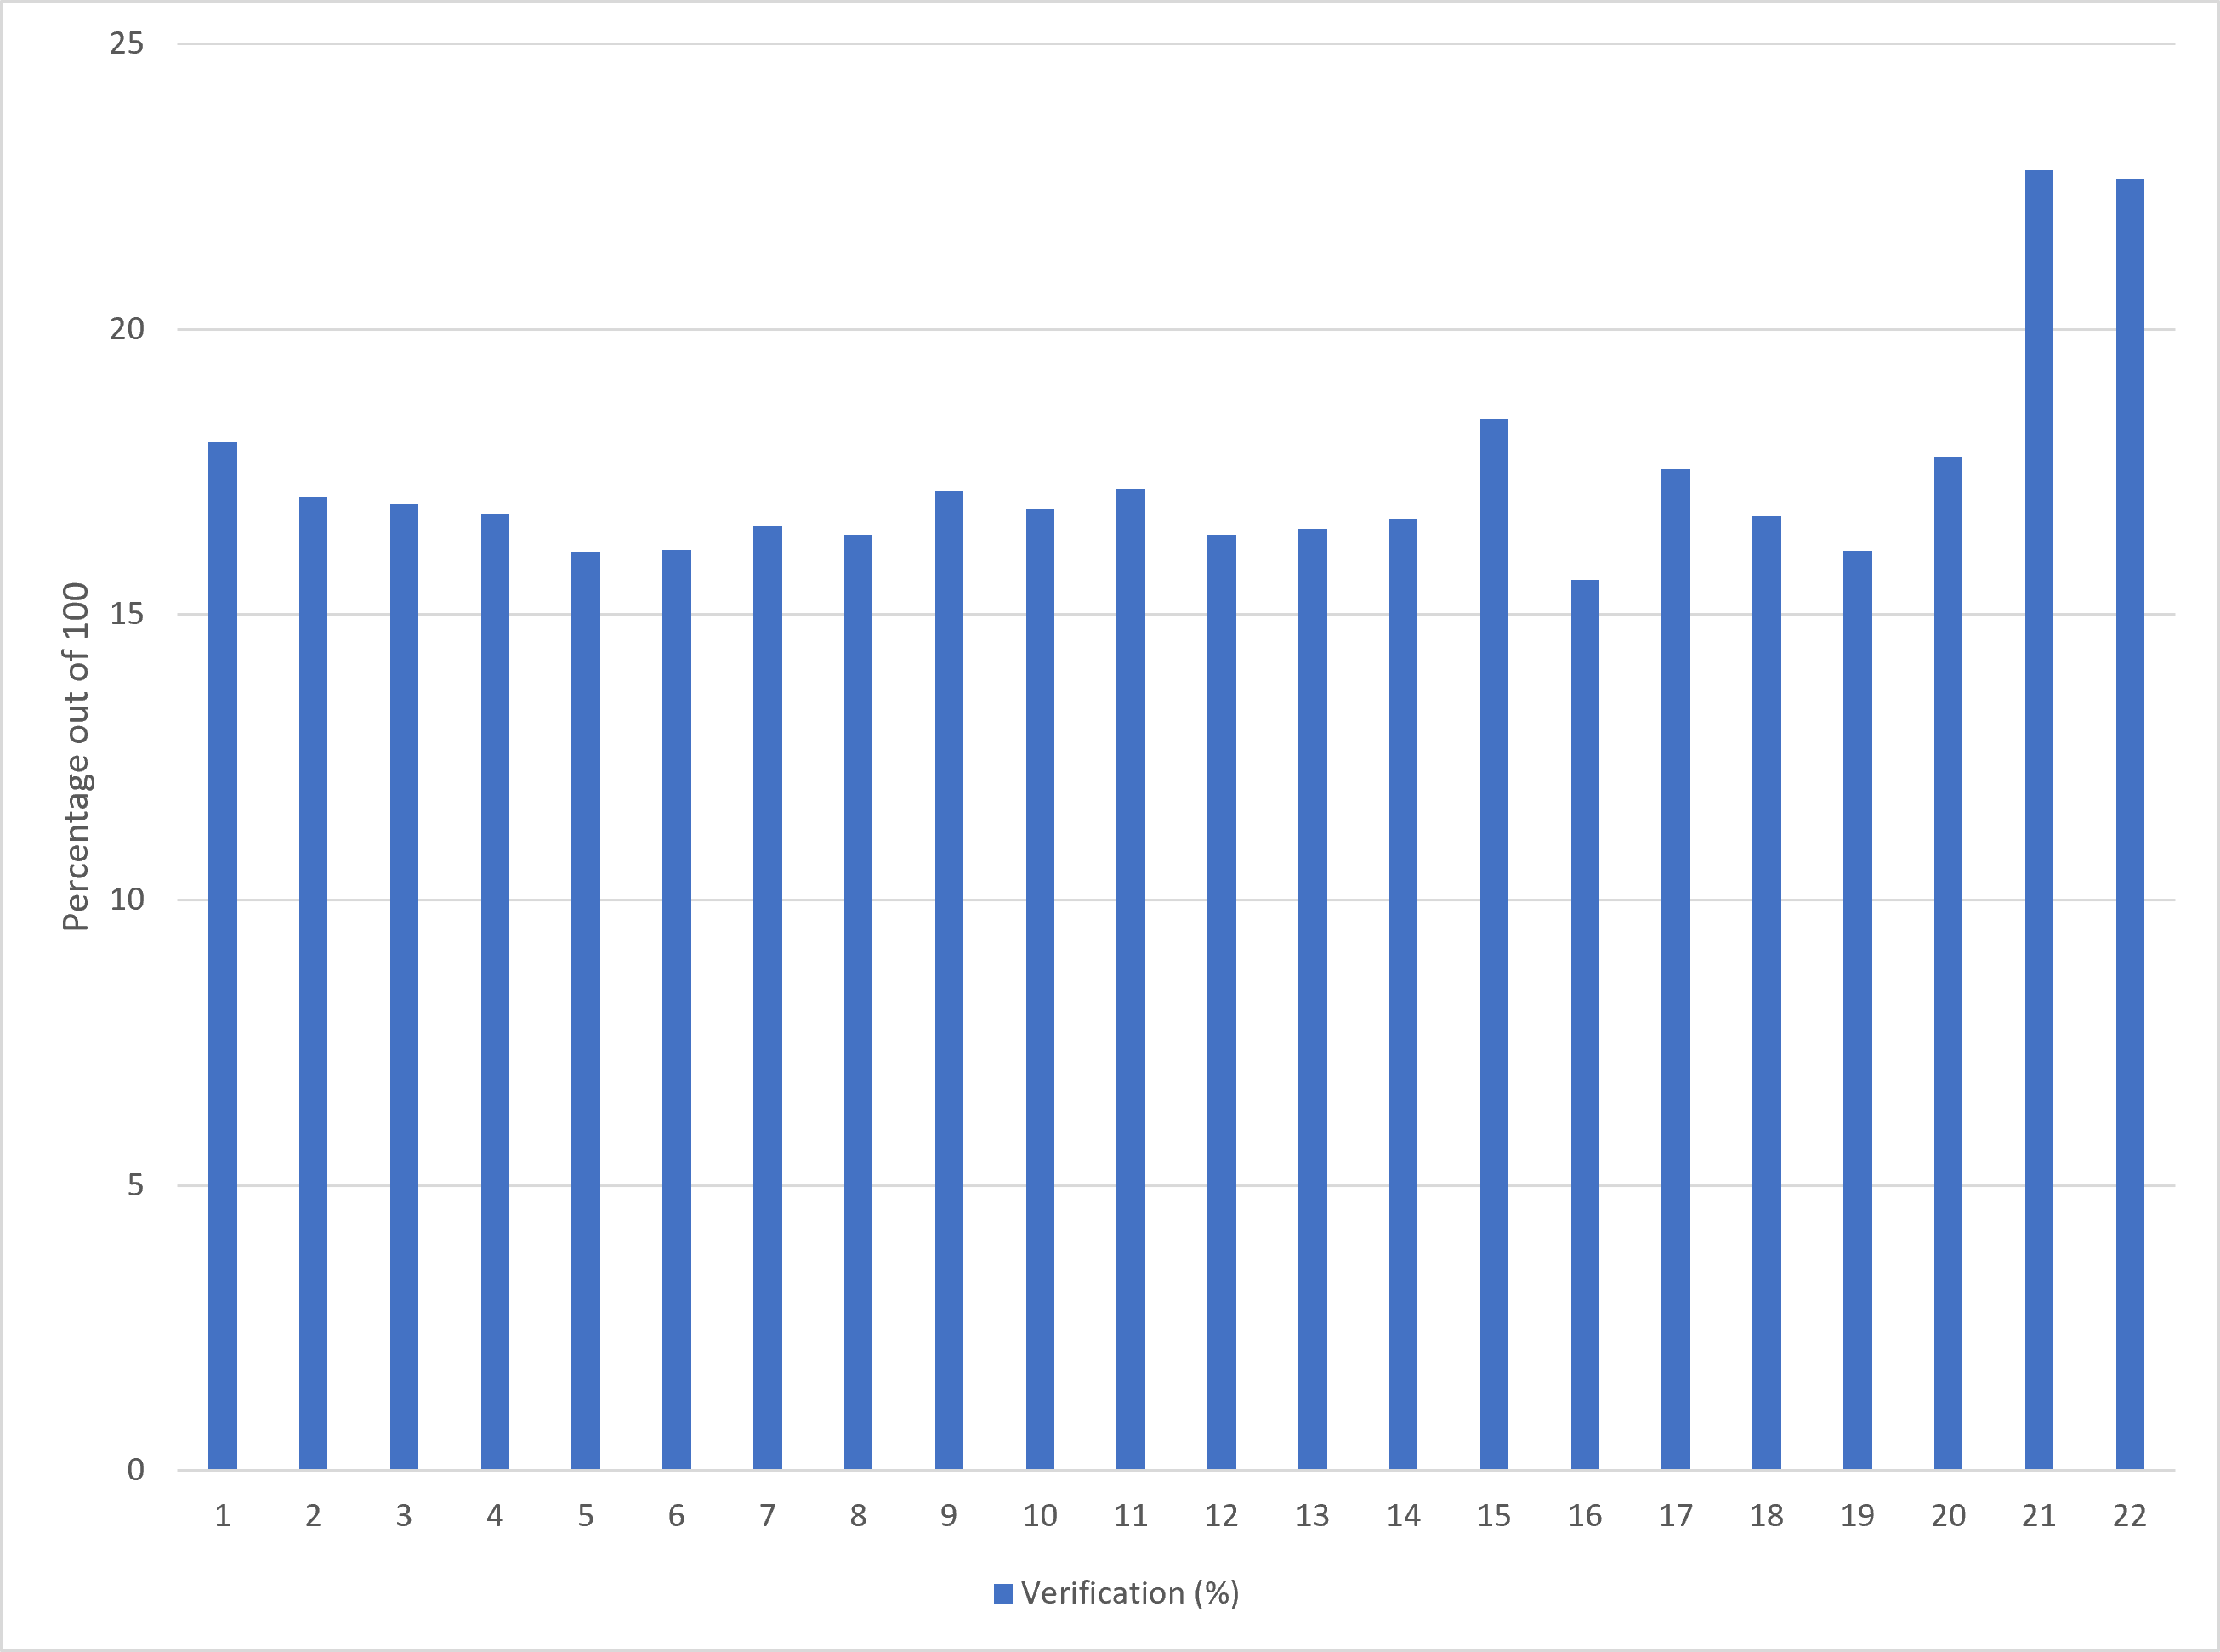
Representative Measurements
| Transaction Type | Verification Share |
|---|---|
| ERC-721 (single transfer) | 22.8% |
| Medium mesh transaction | ~17% |
| Large mesh transaction | ~16% |
Verification overhead remains bounded across all measured workloads.
The measured verification fraction ranges approximately from:
of total transaction gas.
The highest percentage occurs in very small transactions because fixed protocol overhead dominates total cost.
As transaction size increases, the verification fraction decreases slightly because fixed validation costs become amortized across a larger number of transfer commands.
This behavior indicates that GhostShard becomes relatively more efficient as transaction complexity increases.
Verification Scaling Summary
| Relationship | Strength | Interpretation |
|---|---|---|
| Input Shards vs Pre-verification Gas | Moderate | Influenced by calldata size and transaction structure |
| Transfer Commands vs Verification Gas | Strong | Verification cost scales proportionally with work performed |
| Verification Share of Total Gas | Stable | Remains bounded at approximately 16–23% |
Key Finding
The results demonstrate that GhostShard's validation layer scales predictably.
Verification overhead grows approximately linearly with transfer-command count while remaining a minority component of overall gas consumption.
Even for the largest measured transaction, verification remains substantially smaller than execution cost, confirming that the dominant gas consumer is productive protocol work (asset movement and announcement publication) rather than authorization overhead.
11.5 Execution Cost Scaling
This section isolates the asset movement layer of GhostShard — the gas consumed by actual asset transfers, announcement publication, and mesh settlement logic.
Execution gas is measured directly from the inner_execution_gas value emitted by the MeshExecuted event:
Unlike preverification and verification costs, execution gas reflects productive protocol work rather than authorization overhead. As a result, execution gas constitutes the largest component of total gas consumption across all measured transactions.
Figure 11.5.1 — Exxecution Gas vs Transfer Count
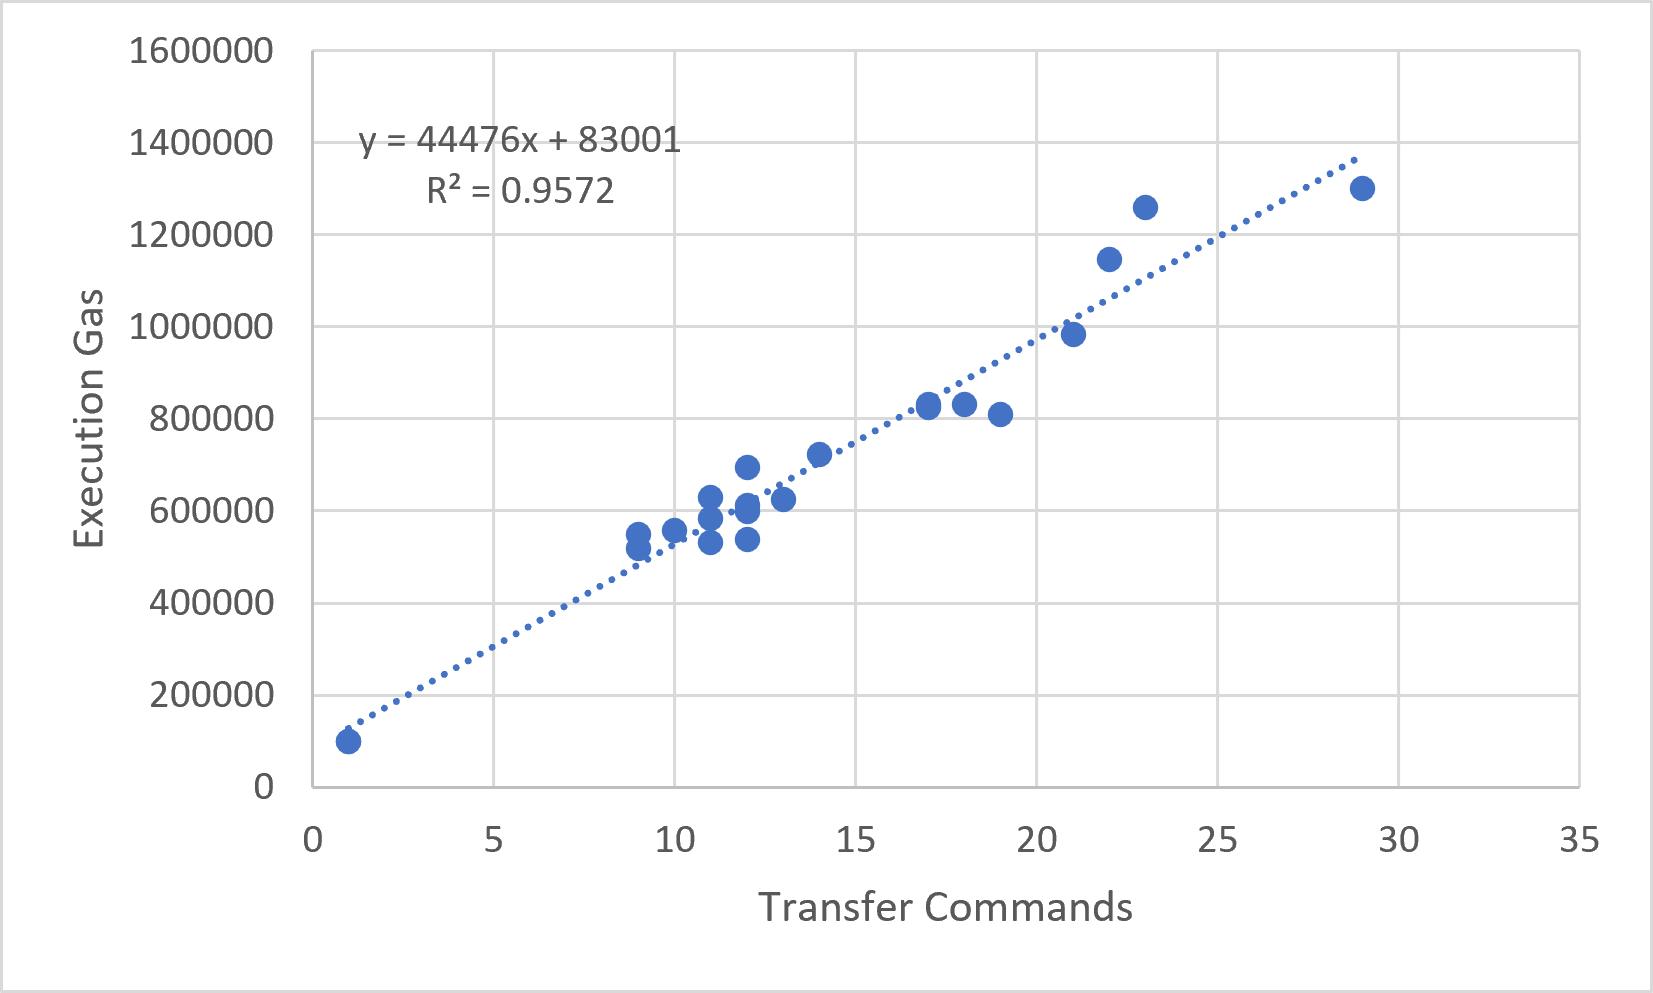
Observation
Execution gas exhibits a strong positive linear relationship with transfer count.
Across the measured dataset:
- Minimum execution gas: 98,909 gas
- Maximum execution gas: 1,301,237 gas
- Transfer count range: 1–29 transfers
The relationship appears highly linear throughout the observed operating range, with no visible evidence of super-linear growth.
Approximate regression:
with:
This indicates that transfer count explains nearly all observed execution-gas variance.
Interpretation
Execution cost scales primarily with the number of transfer commands executed inside the mesh.
The fixed intercept represents:
- Mesh execution setup.
- Internal routing overhead.
- Initial state preparation.
The linear term represents per-transfer work, including:
- Asset transfer execution.
- Announcement generation.
- Output creation.
- Settlement bookkeeping.
The absence of visible curvature in the regression suggests that GhostShard's execution layer scales linearly over the measured range.
Figure 11.5.2 — Execution Gas vs Output Shards
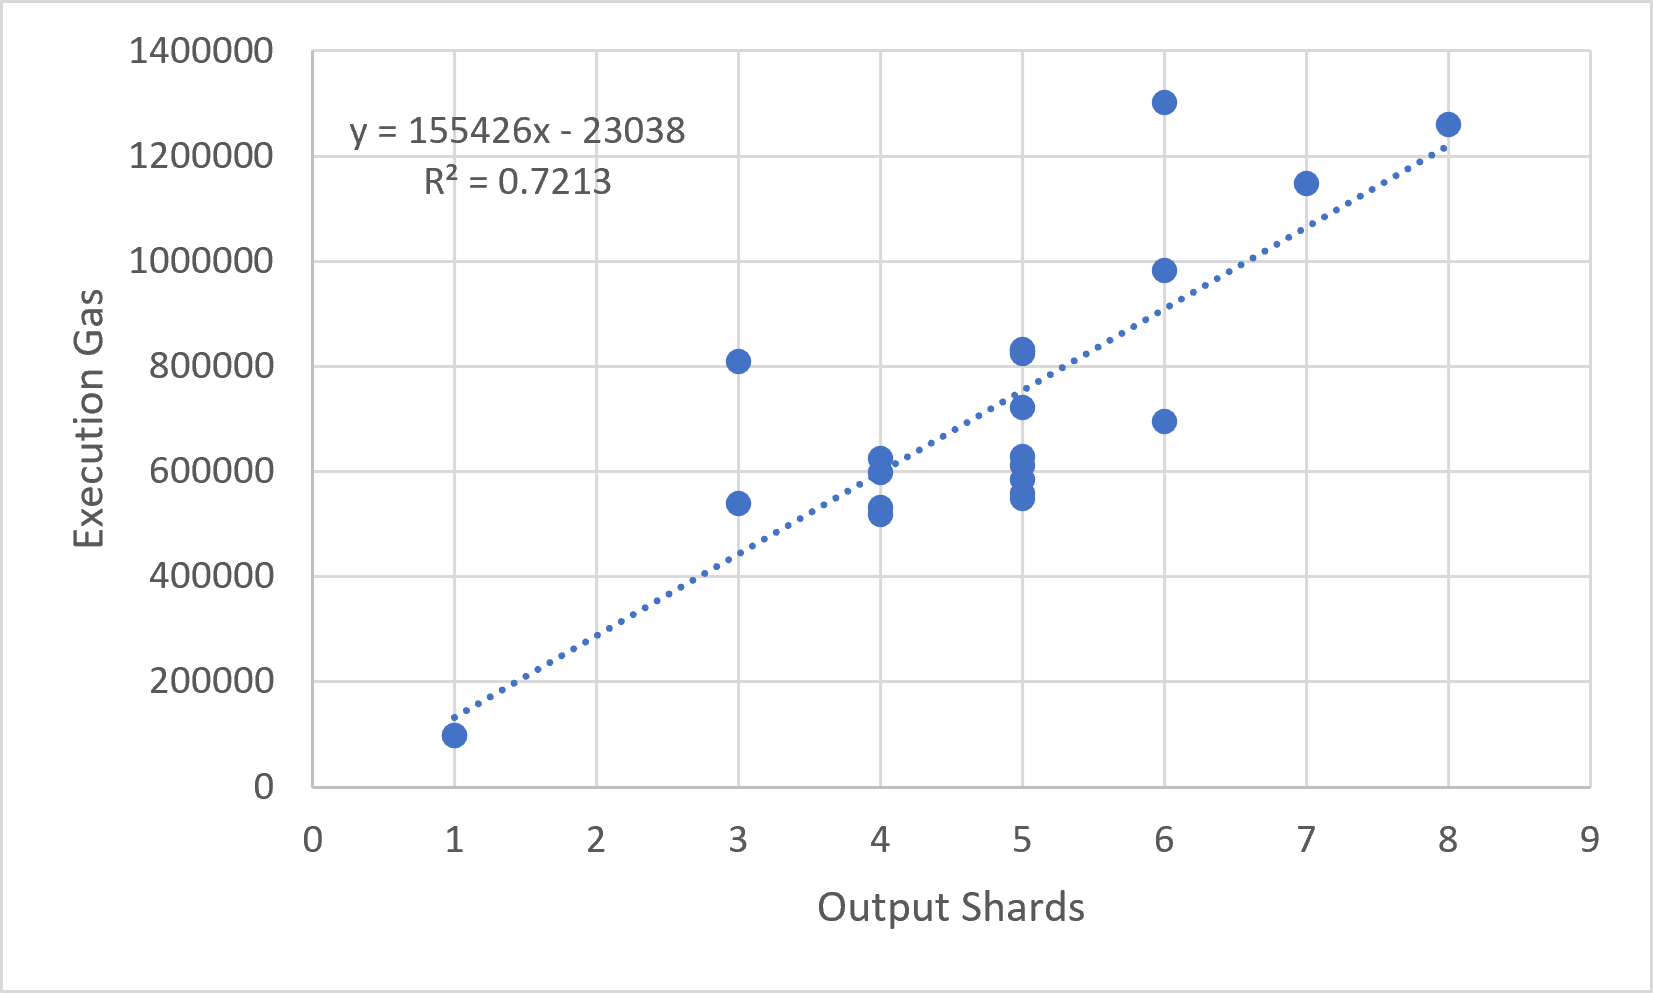
Observation
Execution gas also increases with output count.
Approximate regression:
with:
The relationship is positive but noticeably weaker than the transfer-count relationship.
Interpretation
Output count influences execution gas because every output typically requires:
- Output construction.
- Ownership assignment.
- ERC-5564 announcement publication.
- Settlement bookkeeping.
However, output count is not an independent driver of protocol work.
Many transactions with identical output counts exhibit significantly different execution costs because transfer counts vary substantially.
As a result:
$$ R^2_{N_t}
R^2_{N_o} $$
demonstrating that transfer count remains the dominant execution-cost predictor.
Figure 11.5.3 — Average Execution Gas Composition by Asset Type
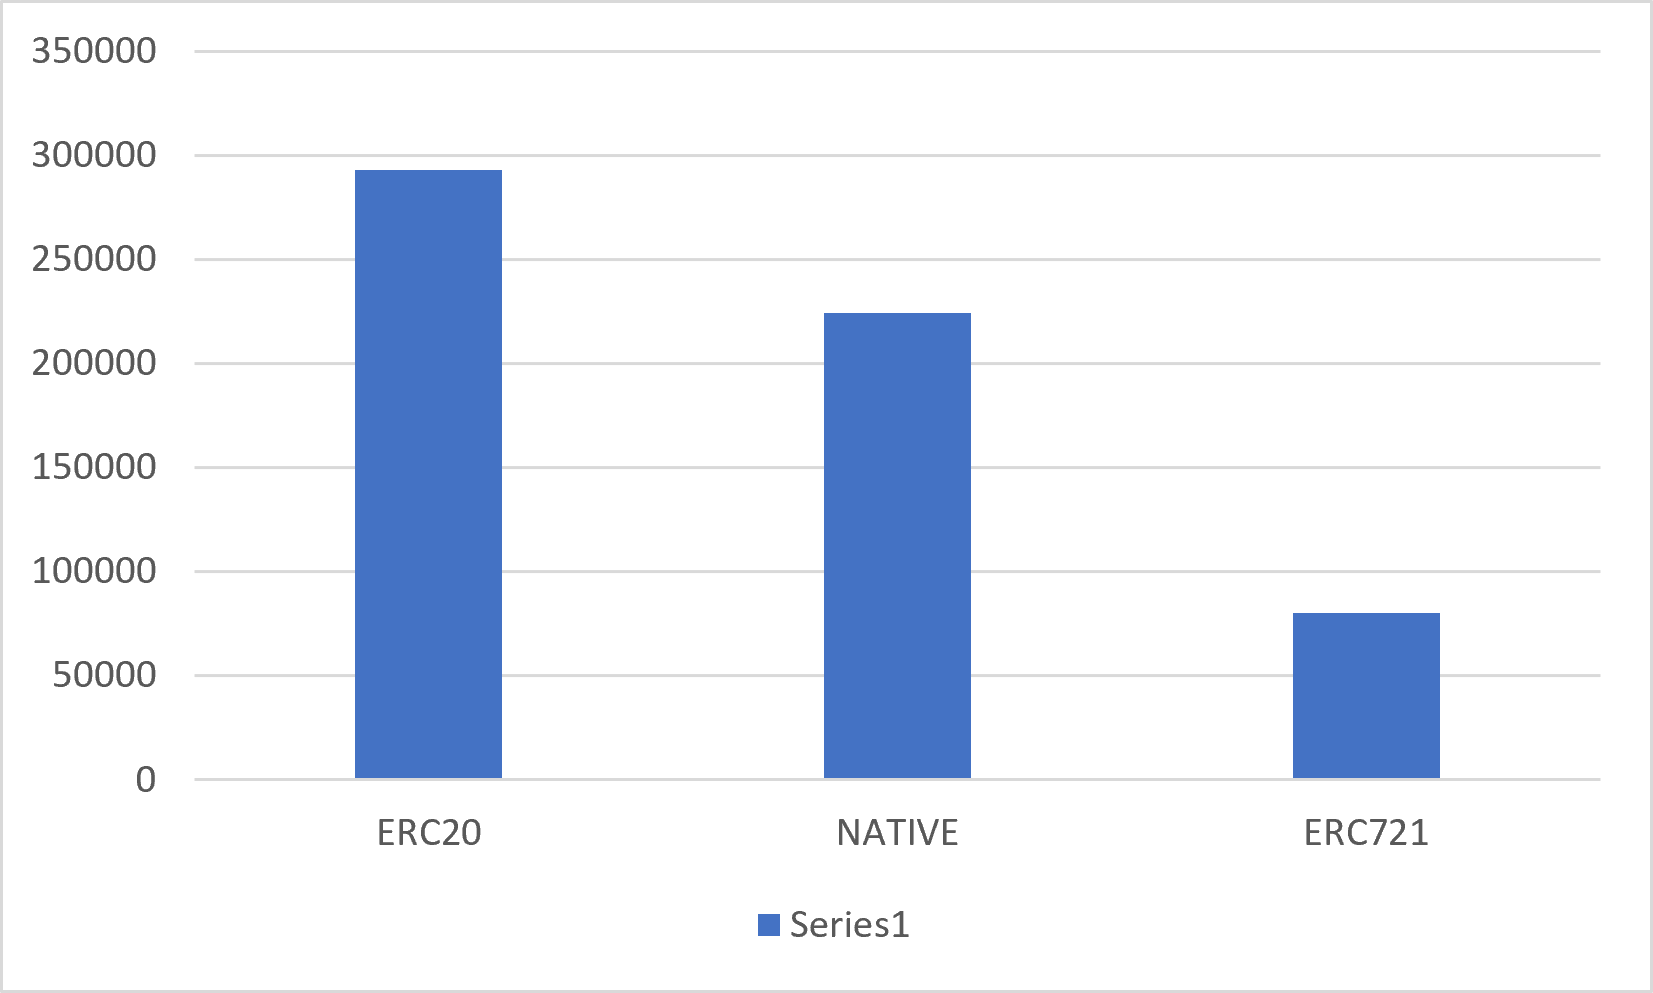
Table 11.5.1 — Average Execution Gas grouped by Asset Type.
| Asset Type | Average Execution Gas |
|---|---|
| ERC-721 | 98,909 |
| Native | 738,512 |
| ERC-20 | 776,367 |
Observation
Execution gas differs across asset classes.
Several observations emerge:
- ERC-20 transactions exhibit the highest average execution gas.
- Native transfers are slightly cheaper than ERC-20 transfers.
- ERC-721 transfers are substantially cheaper in absolute terms due to the measured sample consisting only of single-input, single-output transfers.
The relatively small gap between Native and ERC-20 execution costs suggests that GhostShard amortizes much of its protocol overhead across both asset classes.
Figure 11.5.4 — Execution Share of Total Gas
Observation
Execution gas is the dominant contributor to total gas consumption across all asset classes.
Table 11.5.2 — Average Execution Share of Total Gas.
| Asset Type | Execution Share |
|---|---|
| ERC-721 | 42.7% |
| Native | 63.9% |
| ERC-20 | 60.5% |
Interpretation
Several conclusions follow:
- Execution consistently represents the largest gas component.
- Verification and preverification overheads remain bounded.
- As transaction complexity increases, productive protocol work dominates total cost.
- GhostShard spends the majority of gas on asset movement rather than authorization logic.
This behavior is desirable because it indicates that gas consumption scales primarily with useful work rather than administrative overhead.
Execution Scaling Summary
| Relationship | Approximate \(R^2\) | Interpretation |
|---|---|---|
| \(G_{\text{execution}}\) vs \(N_t\) | 0.96 | Strongest predictor |
| \(G_{\text{execution}}\) vs \(N_o\) | 0.72 | Secondary predictor |
The results demonstrate that execution gas scales linearly with protocol activity.
Transfer command count remains the fundamental unit of work inside GhostShard's execution layer and explains nearly all observed execution-gas variance.
Consequently, transaction complexity is best characterized by:
rather than input count or output count, reinforcing the conclusion reached in Section 11.3.
11.6 Amortization Analysis
This section evaluates how effectively GhostShard amortizes fixed protocol costs as more transfers are bundled into a single mesh transaction.
A core design goal of the protocol is to distribute transaction overhead across multiple transfers. Components such as paymaster validation, calldata processing, authorization verification, and execution setup introduce fixed costs that become less significant as transaction complexity increases.
Figure 11.6.1 — Total Gas per Transfer vs Transfer Count
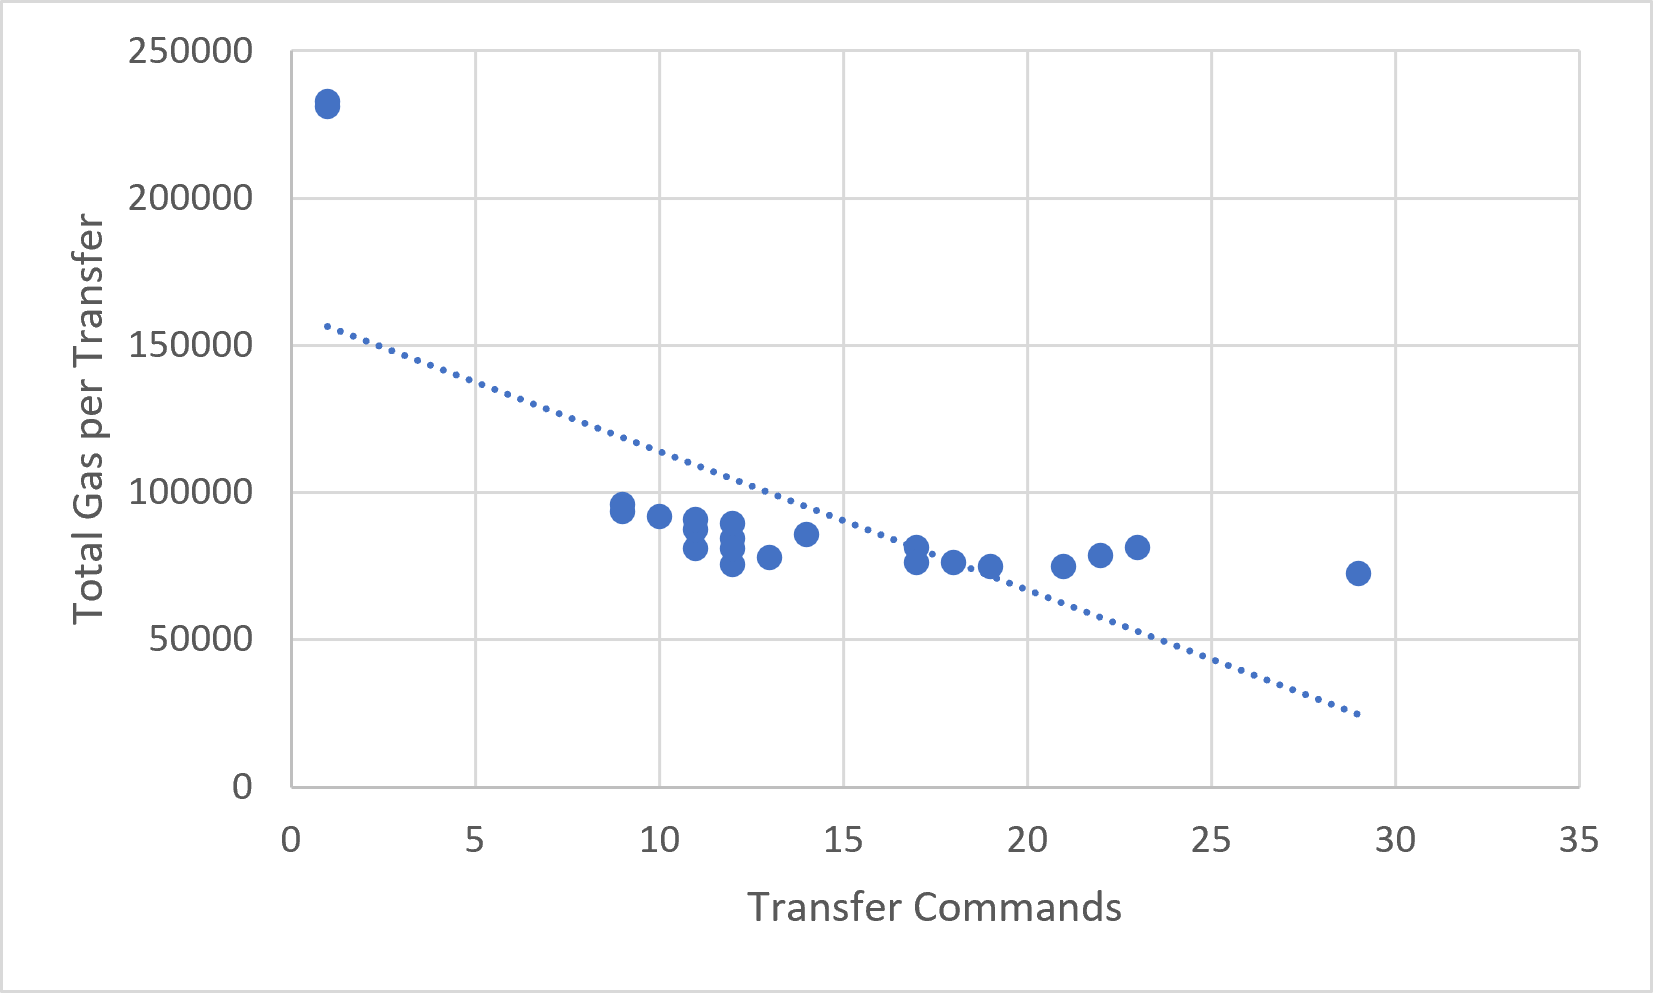
Observation
The dataset shows a strong amortization effect.
Single-transfer transactions exhibit the highest effective cost:
As bundle size increases, effective cost decreases substantially.
The largest measured transaction:
achieves:
representing approximately:
greater efficiency than a single-transfer transaction.
The reduction is not perfectly monotonic because transaction composition varies between samples, but the overall downward trend is clear across the dataset.
Several observations emerge:
- Most amortization benefits are realized between 1 and approximately 12 transfers.
- Beyond approximately 15 transfers, gas-per-transfer begins to stabilize.
- Large bundles consistently remain within the 72k–82k gas-per-transfer range.
- No evidence of efficiency degradation appears at higher transfer counts.
These results indicate that GhostShard successfully distributes fixed transaction costs across multiple transfers.
Figure 11.6.2 — Execution Gas per Transfer vs Transfer Count
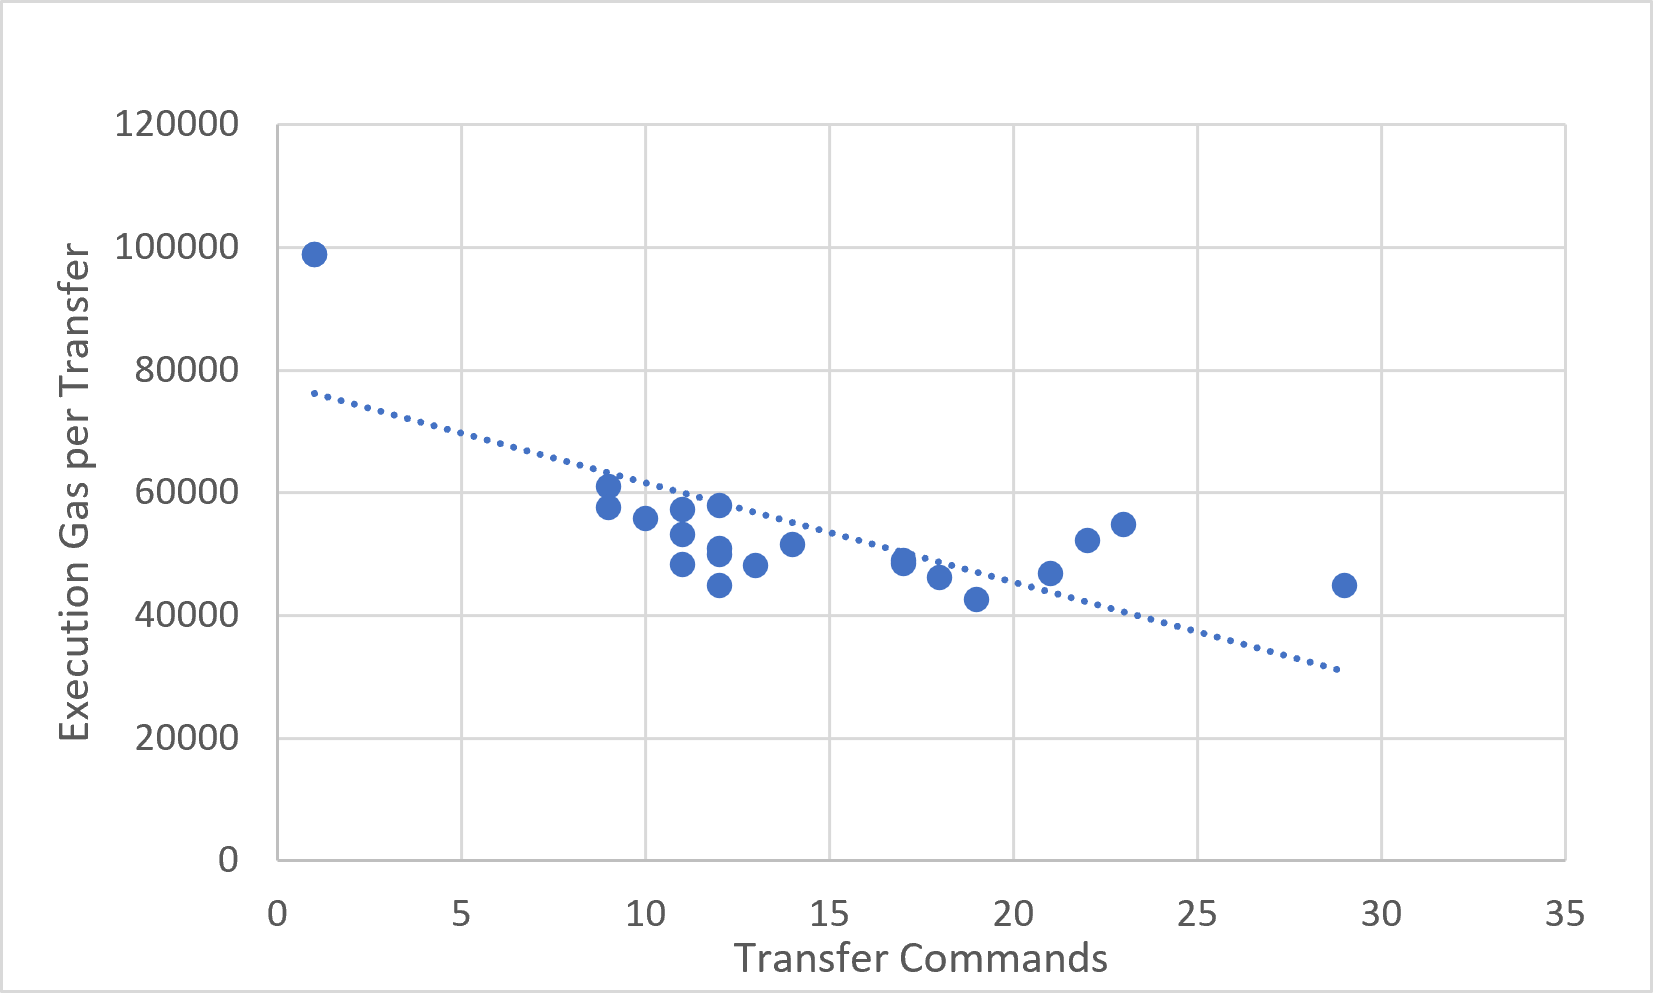
Observation
Execution gas exhibits a similar but weaker amortization trend.
Single-transfer transactions require:
of execution work.
The largest measured transaction reduces this to:
representing approximately:
improvement.
Unlike total gas, execution gas is dominated by actual protocol work:
- Asset transfers
- Ownership updates
- Announcement publication
- Mesh settlement operations
Because these operations scale directly with the number of transfers, execution gas contains a larger variable component and therefore amortizes less aggressively.
The data shows execution gas per transfer stabilizing around:
$$ 45,000
55,000 \text{ gas} $$
for large bundles.
This suggests that the protocol's marginal execution cost approaches a relatively stable per-transfer value.
Figure 11.6.3 — Amortization Efficiency by Gas Component
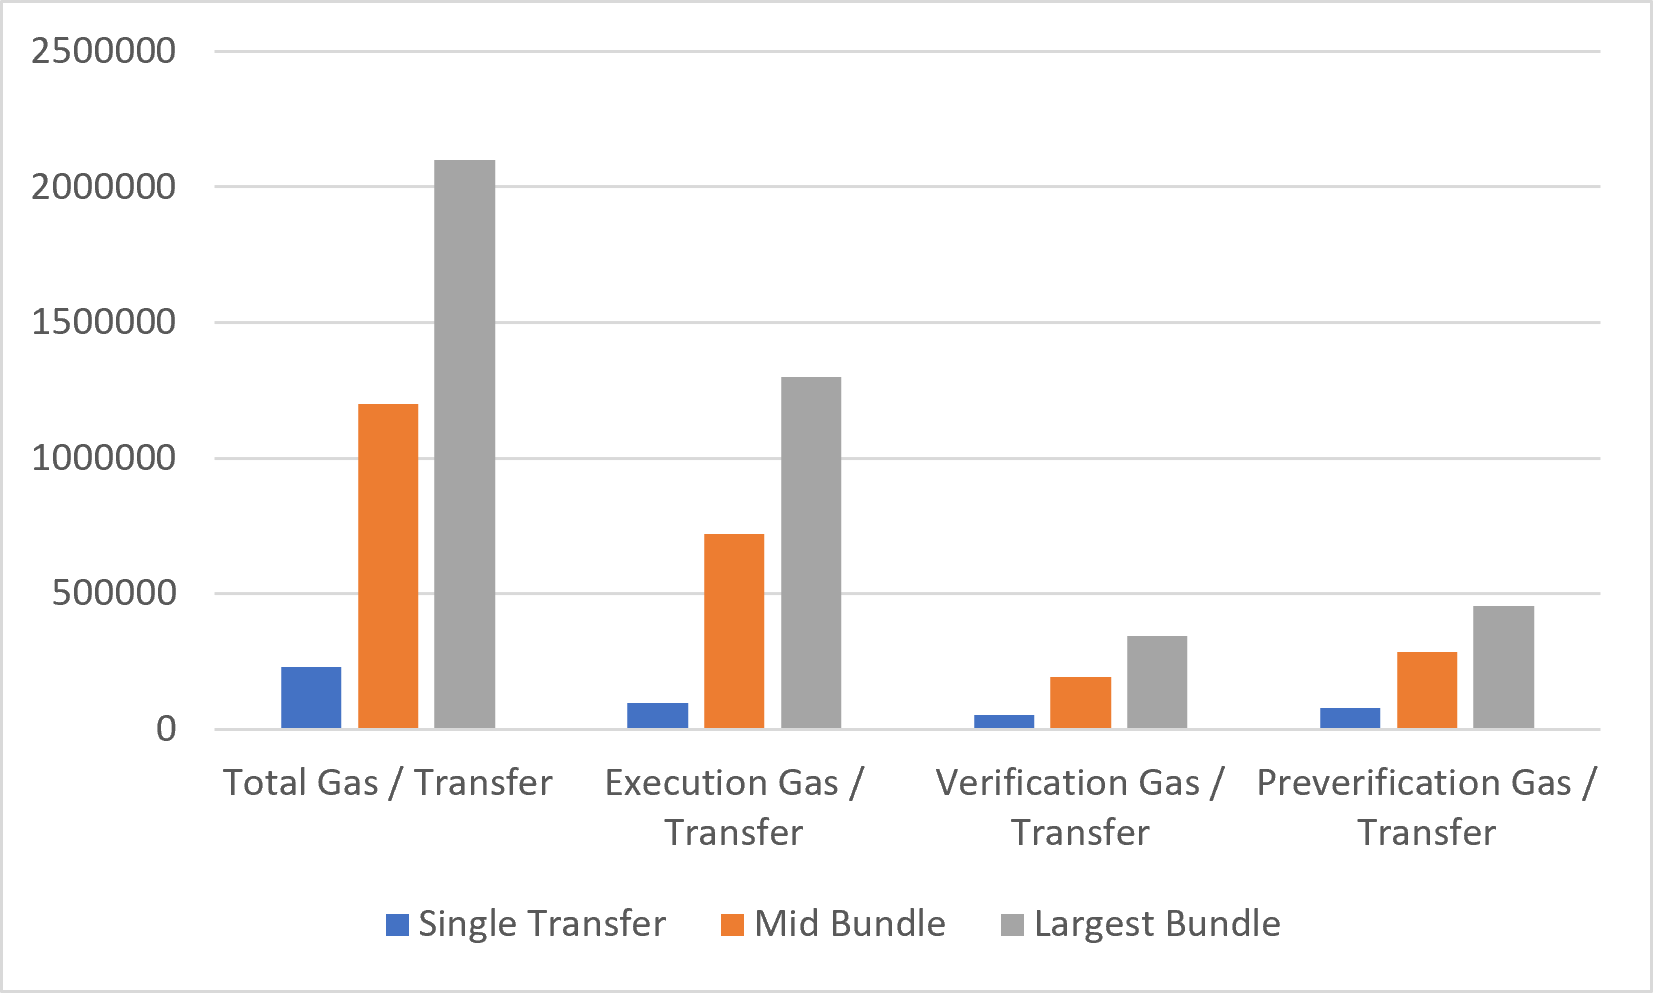
Amortization Efficiency Summary
| Metric | Single Transfer | Largest Bundle (29 Transfers) | Improvement |
|---|---|---|---|
| Total Gas / Transfer | ~232k | 72.4k | ~3.2× |
| Execution Gas / Transfer | 98.9k | 44.9k | ~2.2× |
| Verification Gas / Transfer | 52.7k | 11.9k | ~4.4× |
| Preverification Gas / Transfer | 79.5k | 15.7k | ~5.1× |
Discussion
The strongest amortization occurs in the authorization layer.
Verification and preverification costs contain substantial fixed overhead originating from:
- Paymaster validation
- Authorization processing
- Signature verification
- Calldata decoding
- Transaction setup
These costs are incurred once per transaction and therefore shrink rapidly on a per-transfer basis as bundle size grows.
Execution costs amortize more slowly because they are tied directly to asset movement and announcement publication.
Consequently:
- Preverification achieves the largest efficiency gain (~5×).
- Verification achieves similar savings (~4×).
- Execution improves more modestly (~2×).
- Overall transaction efficiency improves by more than 3×.
The results demonstrate that GhostShard strongly rewards batching behavior. As transaction complexity increases, fixed protocol overhead becomes increasingly negligible relative to productive work, allowing large mesh transactions to operate at substantially lower effective cost per transfer.
11.7 Discovery Performance
GhostShard inherits the ERC-5564 announcement discovery model.
Under ERC-5564, every announcement contains a one-byte view tag that allows wallets to reject approximately 255 out of every 256 announcements before performing an expensive ECDH computation.
Consequently, for a network containing N announcements:
This produces an expected cryptographic workload reduction of approximately:
The discovery complexity therefore becomes:
A detailed analysis of ERC-5564 discovery performance and view-tag filtering can be found in the ERC-5564 specification and associated reference implementations.
Because GhostShard does not modify the ERC-5564 discovery algorithm, its discovery performance inherits these properties directly.## 11.8 Limitations
The results presented in this evaluation provide evidence that GhostShard scales linearly across the tested transaction range and that protocol costs can be decomposed into predictable pre-verification, verification, and execution components. However, several limitations should be considered when interpreting these results.
Dataset Size
The evaluation is based on 22 measured mesh transactions executed on Arbitrum Sepolia.
These transactions span:
- 1–29 transfer commands
- 1–9 input shards
- 1–8 output announcements
- Native ETH, ERC-20, and ERC-721 assets
While the observed relationships exhibit strong linearity, the dataset remains relatively small compared to the space of possible transaction configurations.
Future evaluations should include larger transaction corpora covering hundreds or thousands of mesh executions to further validate the reported regression models.
Asset Coverage
Native ETH and ERC-20 transfers constitute the majority of measured transactions.
ERC-721 measurements are limited to two single-transfer transactions.
Consequently:
- ERC-721 baseline costs are measured.
- ERC-721 scaling behavior is not empirically validated.
- Multi-transfer ERC-721 mesh executions remain future work.
The conclusions regarding linear execution scaling therefore apply most strongly to Native ETH and ERC-20 transfers.
Network Environment
All measurements were collected on Arbitrum Sepolia.
Gas accounting is expected to remain structurally similar across EVM-compatible networks; however:
- calldata pricing differs across chains,
- base transaction costs vary,
- execution environments evolve over time,
- future protocol upgrades may affect gas accounting.
Absolute gas values should therefore be interpreted as implementation-specific measurements rather than universal constants.
The scaling relationships are expected to be more portable than the absolute gas numbers.
Discovery Performance
Announcement discovery results are derived from protocol structure and ERC-5564 view-tag mechanics rather than direct large-scale network measurements.
The evaluation demonstrates the theoretical reduction in cryptographic workload:
through view-tag filtering.
However:
- million-announcement datasets were not generated,
- large-scale wallet synchronization was not benchmarked,
- RPC latency effects were not directly measured.
The discovery analysis should therefore be interpreted as an analytical scalability evaluation rather than a production-scale benchmark.
Compression Behavior
The compression examples demonstrate the reduction in shard count achievable through mesh execution.
However, long-term compression equilibrium was not evaluated.
Specifically:
- user deposit patterns were not simulated,
- user withdrawal patterns were not simulated,
- adversarial fragmentation behavior was not simulated,
- multi-month shard evolution was not modeled.
As a result, the observed compression efficiency should be viewed as representative examples rather than equilibrium measurements.
Throughput and Concurrency
This evaluation focuses on per-transaction cost rather than network throughput.
The following metrics were not measured:
- paymaster throughput,
- relayer throughput,
- bundler throughput,
- concurrent user activity,
- announcement propagation rates,
- sustained network load.
Consequently, the results establish transaction-level scalability but do not characterize maximum network capacity.
Implementation Version
All measurements reflect the current GhostShard implementation.
Future protocol improvements may materially alter observed costs, including:
- authorization compression,
- announcement aggregation,
- calldata optimization,
- verification-path improvements,
- compression heuristics.
Therefore, the reported values should be interpreted as measurements of the evaluated implementation rather than permanent protocol limits.
Threats to Validity
Several factors may influence the generality of the reported results:
- Limited ERC-721 sampling.
- Testnet execution environment.
- Absence of large-scale user simulations.
- Absence of production-scale discovery benchmarks.
- Absence of long-term compression modeling.
Despite these limitations, the strongest findings of the evaluation remain consistent across the entire dataset:
- Total gas scales approximately linearly with transfer count.
- Verification gas scales approximately linearly with transfer count.
- Execution gas scales approximately linearly with transfer count.
- Gas-per-transfer decreases as bundle size increases.
- View-tag filtering reduces discovery workload by approximately 256×.
These observations support the central claim that GhostShard achieves scalable privacy-preserving asset transfer through transfer-count-driven execution rather than shard-count-driven execution.